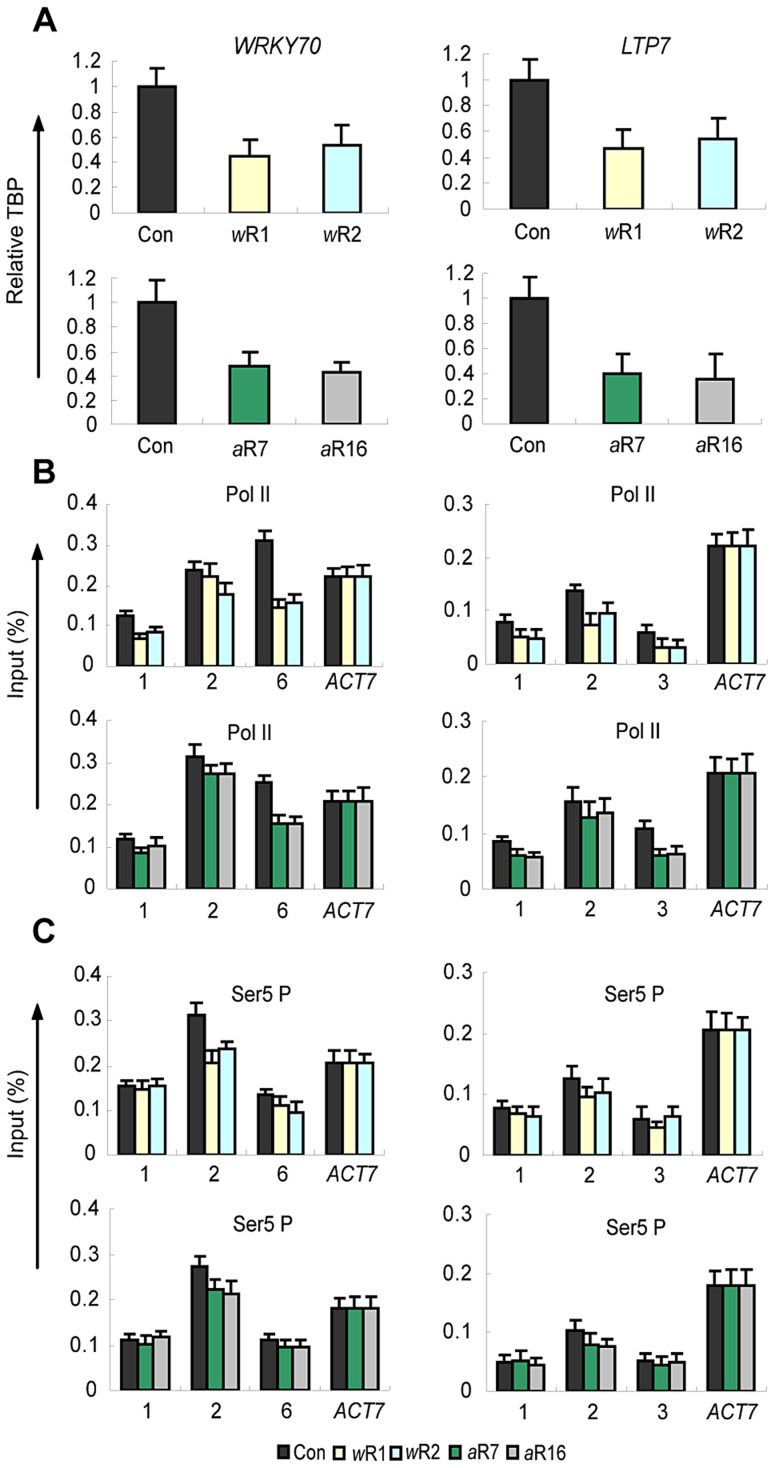
Figure 4. Distribution patterns and levels of TBP, of total RNA Pol II, and of Ser5P Pol II.
A) Relative TBP levels at the promoters of the WRKY70 and LTP7 genes in empty vector control (Con) plants, in AtWRD5-RNAi (wR1, wR2) lines (top panel) and the AtASH2-RNAi (a2R7, a2R16) lines (bottom panel). ACT 7 is used as an internal control; B–C) total Pol II and Ser5P distribution profiles along the genes in control (Con) and RNAi knockdown genotypes as specified above. Amplified regions are numbered as indicated in Figure 2A. ChIP-PCR values with IgG in all genetic backgrounds were <0.001 of the input levels (not shown). Each experiment was repeated at least three times. Each bar is standard errors of the mean (±SEMs, n = 3).

