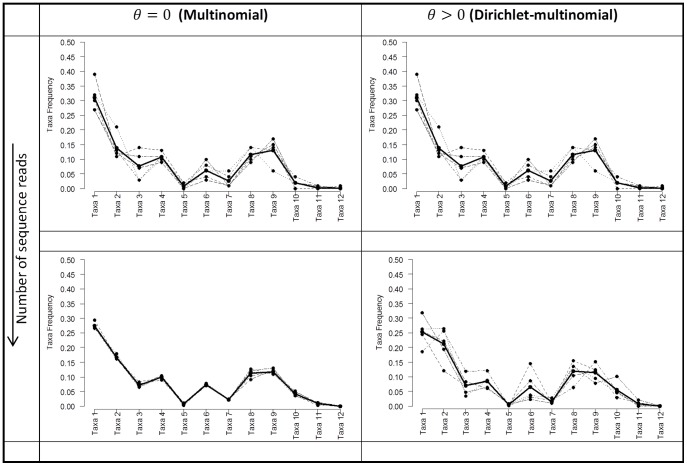
Figure 1. Description of Dirichlet-multinomial parameters.
Intuitive description of the meaning of the overdispersion parameter  . The four plots show the taxa frequencies
  for each of the five hypothetical samples (dashed lines) with 12 taxa in each sample, and the corresponding weighted average across the five samples given by the vector of taxa frequencies
  (solid line). The plots on the left show the taxa frequencies of samples drawn from a Multinomial distribution
  and the plots on the right show taxa frequencies of five samples drawn from a Dirichlet Multinomial
 . The top row of plots is for samples with a smaller number of sequence reads, while the bottom row of plots is for samples with a larger number of sequence reads. As the number of reads increases for the multinomial distribution increases each samples taxa frequencies converge onto the mean, while for the Dirichlet-multinomial an increased number of reads is still associated with the same variability between the individual samples.

