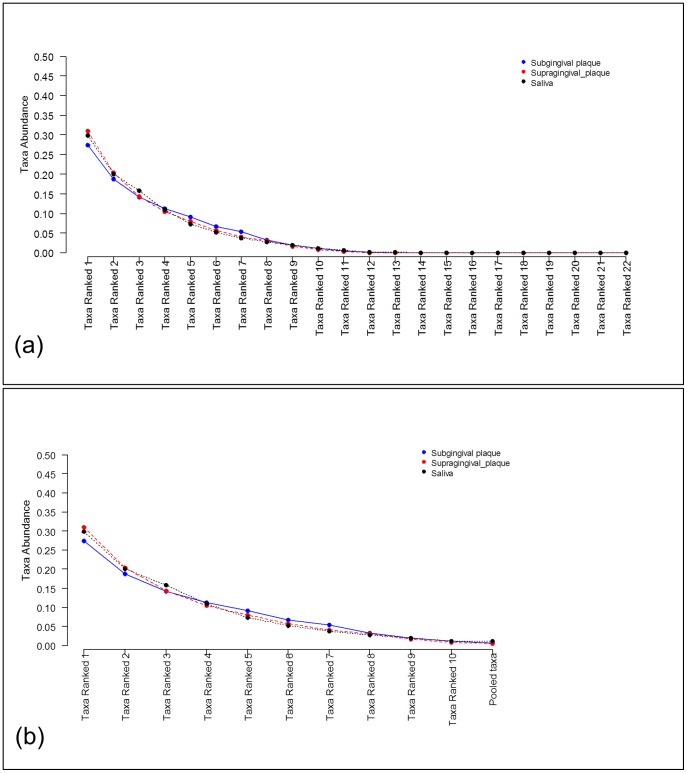
Figure 6. Comparison of three metagenomic groups using rank abundance distribution data.
Ranked taxa frequencies mean at class level obtained from subgingival plaque samples (blue curve) and from supragingival plaques samples (red curve): a) The means of all ranked taxa frequencies found in each group; b) The mean of ranked taxa frequencies whose weighted average across both groups is larger than 1%. The remaining taxa are pooled into an additional taxon labeled as ‘Pooled taxa’.

