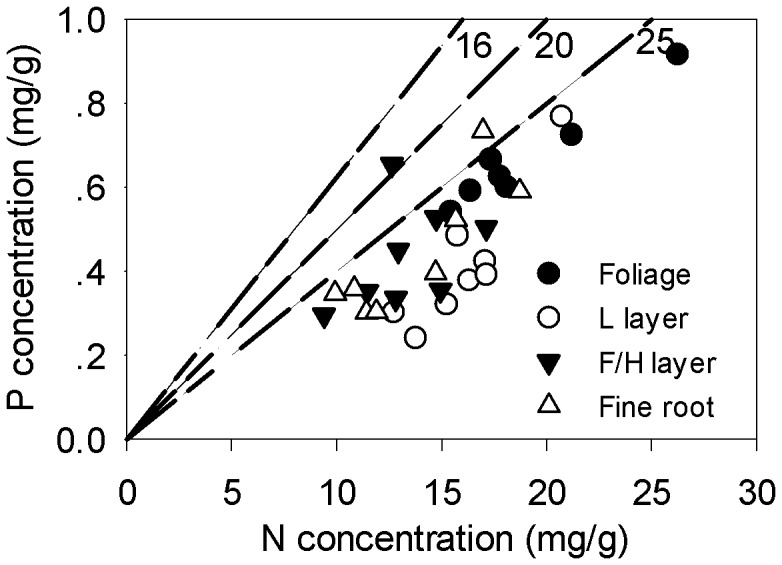
Figure 5. Mean N and P concentrations of plant materials of eight study forests.

Dashed lines depict N:P ratios of 16, 20 and 25 on a mass basis. Ratios of 16 and 20 are P limitation thresholds of plant growth proposed by Koerselman and Meuleman (1996) [34] and Güsewell (2004) [31], respectively; ratio of 25 is the critcial N:P ratio that indicates P limitation on litter decomposition proposed by Güsewell and Verhoeven (2006) [61].
