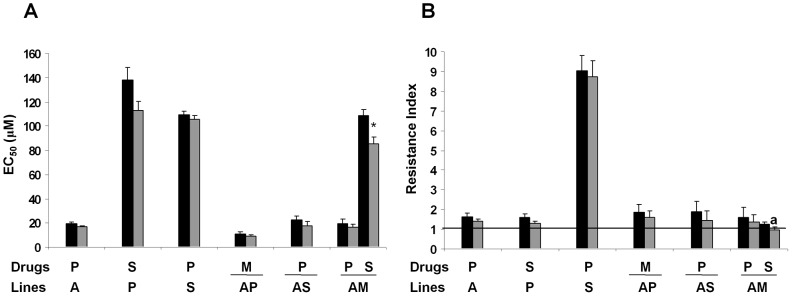
Figure 2. Stability of cross-resistance to drugs in L. donovani promastigote lines.
(A) The stability of cross-resistance at 1 month after removal of drug pressure (gray columns), relative to initial EC50 (black columns), was determined. The results are the average of three independent experiments ± SD. Significant differences versus the initial EC50 were determined using Student's t-test (*: p<0.005). (B) Results from panel A expressed in terms of resistance index. The horizontal black line represents a resistance index of 1 equivalent to a completely loss of resistance. a: line that lose resistance after 1 month in a drug-free medium.

