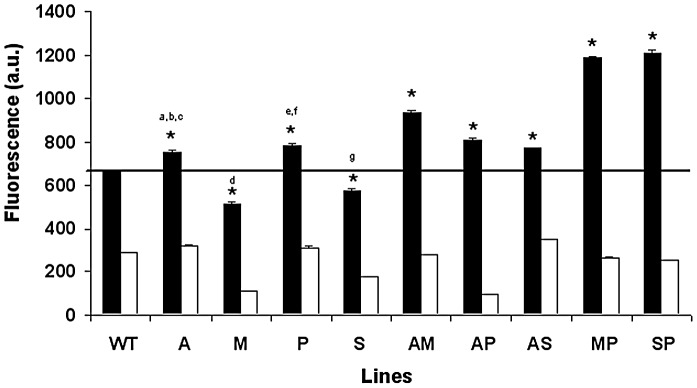
Figure 3. Thiol levels in L. donovani promastigote lines.
Log-phase promastigotes from WT and resistant lines were labelled with 2 µM CellTracker (black columns), and fluorescence was analyzed as described in the Materials and Methods section. Promastigotes were depleted of thiols by treatment with 3 mM BSO (a γ-glutamylcysteine synthetase inhibitor) for 48 h at 28°C (white columns). The results are the average of three independent experiments ± SD. All lines show significant differences with respect to WT (*: p<0.001) and when comparing singly versus doubly-resistant lines using Student's t-test (a: p<0.05 A vs. AS; b: p<0.005 A vs. AP; c: p<0.001 A vs. AM; d: p<0.001 M vs. AM or MP; e: p<0.05 P vs. AP; f: p<0.001 P vs. MP or SP; g: p<0.001 S vs. AS or SP). The black line indicates the threshold at which the thiol levels have been modified with respect to WT.

