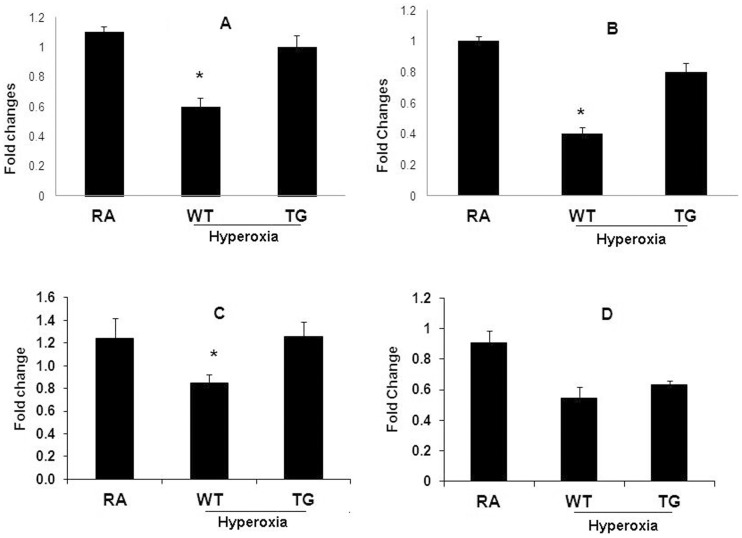
Figure 3. This panel demonstrates all RT-qPCR results in all groups after exposure to hyperoxia (95% FiO2 for 7 days) in comparison to control air group.
A: RT-qPCR of VEGFR1 expression. B: RT-qPCR of VEGFR2 expression. C: RT-qPCR of VEGF. D: RT-qPCR of PECAM-1 expression. Data are mean of 10 animals/group ± SEM, * P<0.05.

