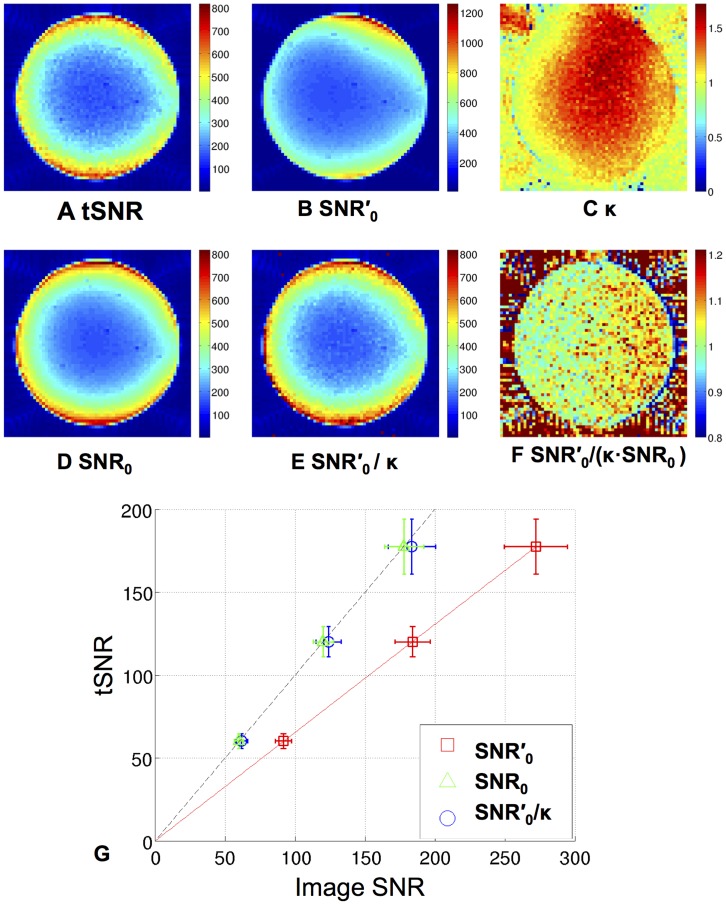
Figure 2. Validation of extended model fit for phantom data acquired at 3T using a 32-channel RF head receive coil.
Results for a single central slice through phantom data show maps of A) tSNR, B) SNR′0 C) κ, D) SNR0 E) SNR′0/κ F) SNR′0/(κ ·SNR0). The tSNR and SNR maps are shown for the EPI data acquired with the largest flip angle (90°). The κ map was estimated by fitting the extended model to each voxel of the tSNR and SNR′0 maps calculated from EPI time series acquired at 3 different flip angles (17°, 37° and 90°). In G, a plot of the mean and SD of tSNR against SNR′0 (red squares), SNR0 (green triangles) and SNR′0/κ (blue circles) within a 20×20 voxels ROI at the centre of the phantom is shown for all flip angle time series and the red solid line shows the fit of the extended model to the SNR′0 values. The black dashed line is the line of identity.

