
Figure 3. Fit of extended model to human task-free fMRI data acquired at 7T with a 24-channel receive head coil.
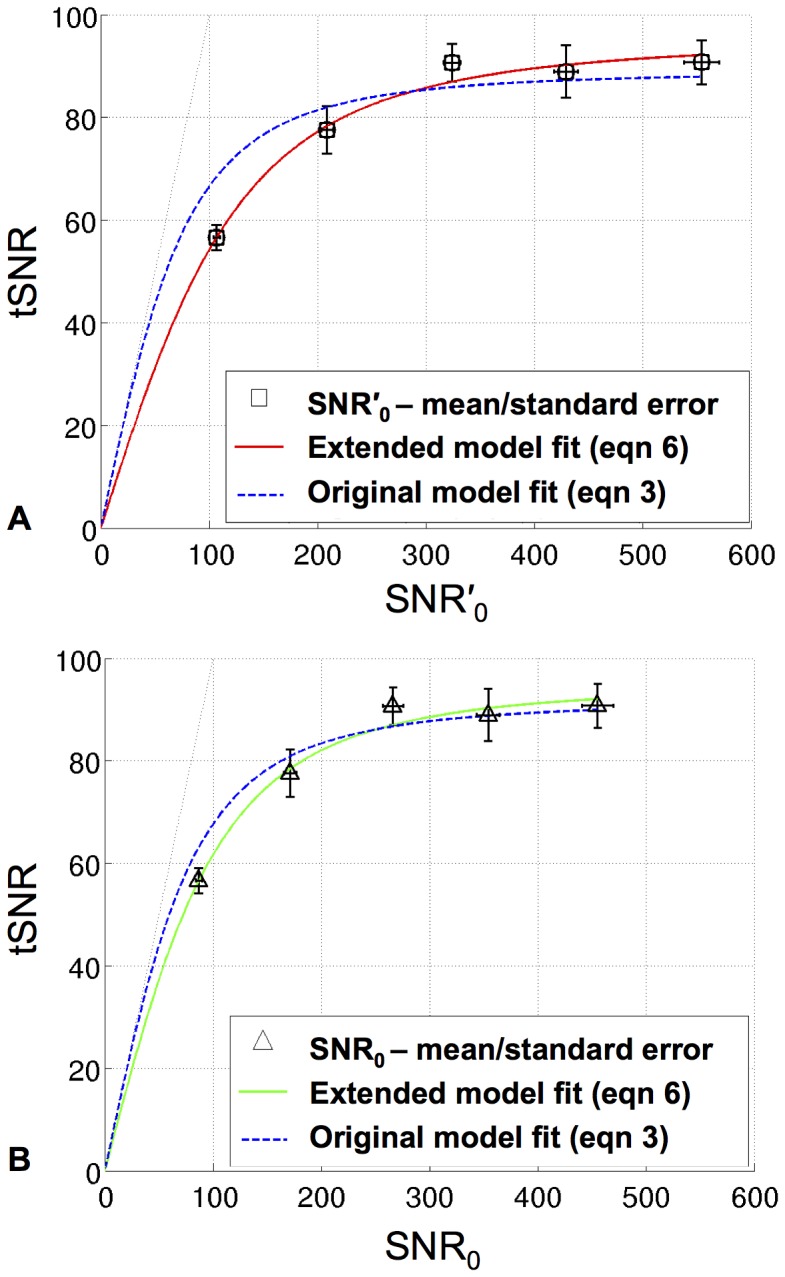
A) Plot of tSNR against SNR′0 is shown for EPI time series acquired using 5 different flip angles (8°, 16°, 26°, 38° and 70°). Each data point (black squares) represents the mean and standard error over 5 subjects of mean tSNR and SNR′0 in the VC ROI. The solid red line represents the fit of the extended model (using equation 6) and the blue dashed line represents the fit of the original model (using equation 3). B) Plot of tSNR against the independently measured SNR0 for the same data as in (A). Black triangles represent the mean and standard error over 5 subjects, the solid green line represents the fit of the extended model (using equation 6) and the blue dashed line represents the fit of the original model (using equation 3).