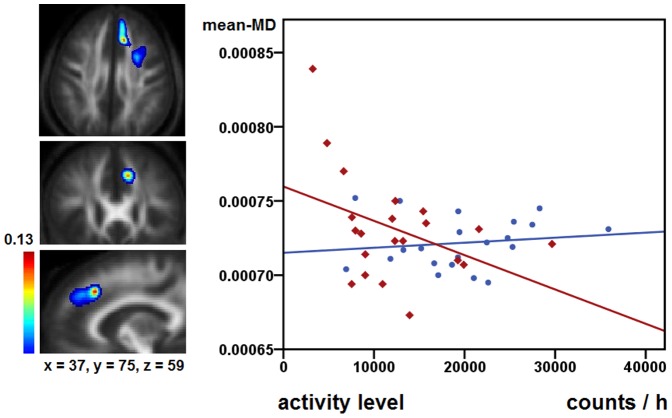
Figure 3. Association of white matter microstructure and activity level in the left dlPFC-pre-SMA pathway.
The first column displays mean probability maps of the left dlPFC-pre-SMA connection averaged on both groups and overlaid on mean-FA images of the subjects. The voxel values represent an estimation of the probability that the voxel is part of the fibre bundle of interest (PIBI). To remove random artefacts, only voxels with PIBI values >0.0148 were included in probability maps [52], [53]. Maximum PIBI values are displayed at the top of the colour bar. The displayed figures illustrate anatomical pathways from where mean-MD values have been extracted. The second column displays mean-MD values extracted from the displayed connection and the corresponding activity level values of the respective subjects. Controls are displayed as blue circles, patients as red diamonds.

