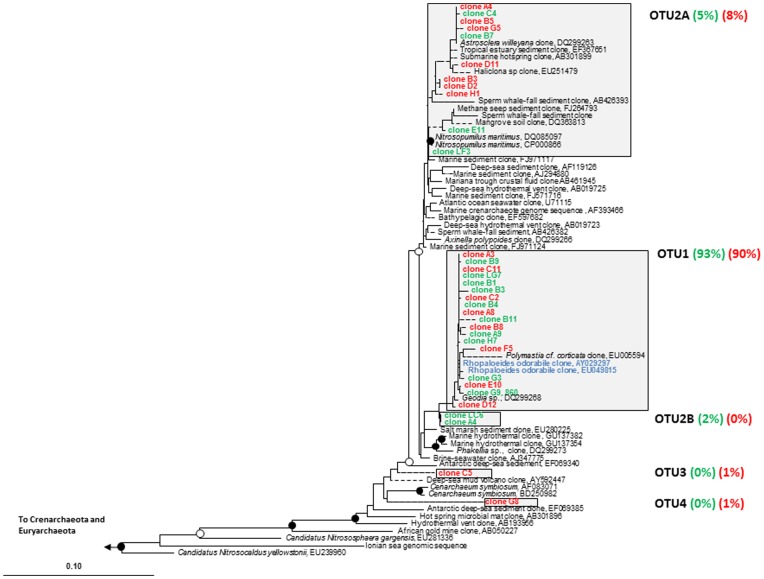
Figure 4. Maximum likelihood phylogenetic tree from analysis of 16S rRNA gene sequences of archaeal clone libraries.
The tree is constructed based on long (≥1200 bp) sequences only; shorter sequences were added using the parsimony interactive tool in ARB and are indicated by dashed lines. Filled circles indicate bootstrap support (maximum parsimony, with 1000 resamplings) of ≥90%, and open circles represent ≥75% support. Bar, 10% sequence divergence. Sequences from medium nutrient clone library are in red and ambient library in green. Blue sequences represent archaea previously reported from healthy R. odorabile (Webster et al., 2001). The proportion of each OTU from treatment libraries (red or green) are in parentheses.

