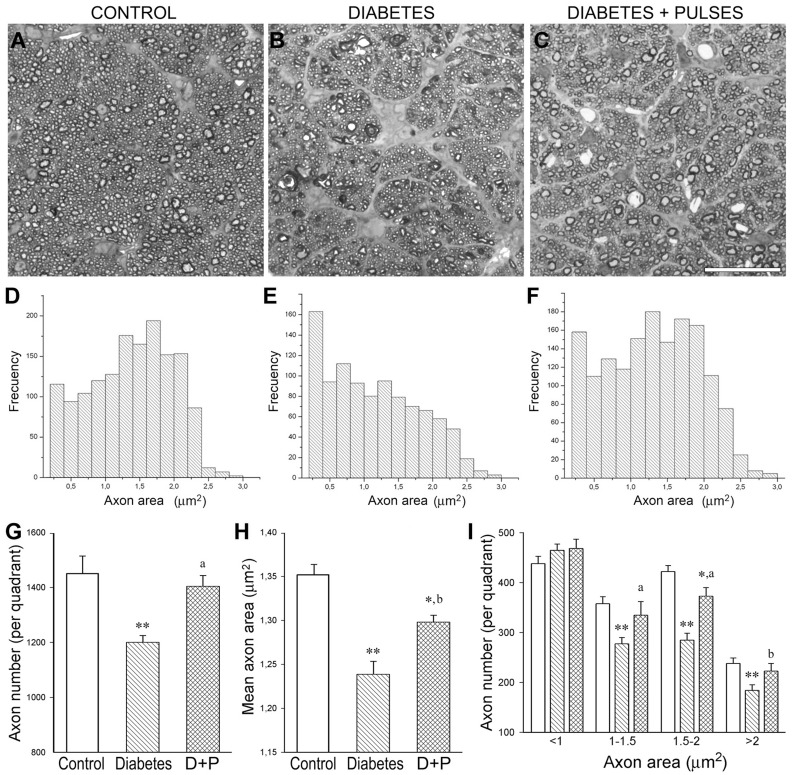
Figure 3. Morphometric analysis of the myelinated distal ON portion.
Light micrographs of semithin transverse sections at the distal ON portion from a control rat (A) and a 6-week diabetic rat without (B) or with ischemic conditioning (C) are shown in the upper panel. D-F: Size-frequency histograms showing the axon area distribution at the distal ON portion. In the diabetes+sham group, a significant reduction in the total axon number (G) and in the mean axon area (H), particularly affecting large axons (I), was found. The application of ischemic pulses prevented these alterations. No differences in the ON transversal area were found among groups. Data are mean ± SEM (n = 6 nerves/group); * p<0.05, ** p<0.01 versus age-matched controls, b p<0.05, a p<0.01 versus diabetic ON from sham-treated eyes, by Tukey’s test. Scale bar = 25 µm. D+P: diabetes+pulses.

