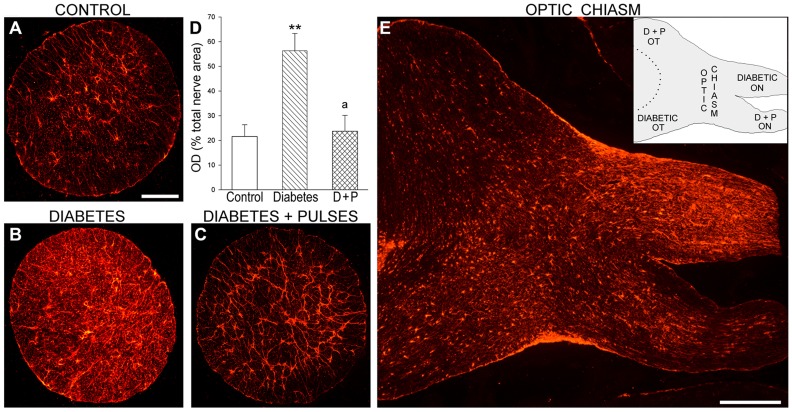
Figure 4. Astrocyte analysis at the distal ON portion.
Representative GFAP-immunostaining in transverse sections from a control (A) and diabetic ONs from an eye without (B) or with (C) ischemic conditioning are shown. In the ON from the diabetes+sham group, the area occupied by astrocytes (measured as total optical density (OD)) was significantly increased (D). Ischemic conditioning prevented these alterations. In panel E, a horizontal section through the optic chiasm (containing part of the ON and the optic tract) from a representative diabetic rat is shown. Note a clear decrease of GFAP-immunoreactivity in ON and the optic tract from the conditioned eye as compared with the contralateral (sham-treated) pathway. The inset is a schematic representation of the horizontal section. Data are mean ± SEM (n = 6 nerves/group); ** p<0.01 versus age-matched controls, a p<0.01 versus diabetic ON from sham-treated eyes, by Tukey’s test. Scale bar: A = 200 µm, E = 600 µm. D+P: diabetes+pulses; OT: optic tract.

