
Figure 1. Experimental thermocycles and constant temperatures.
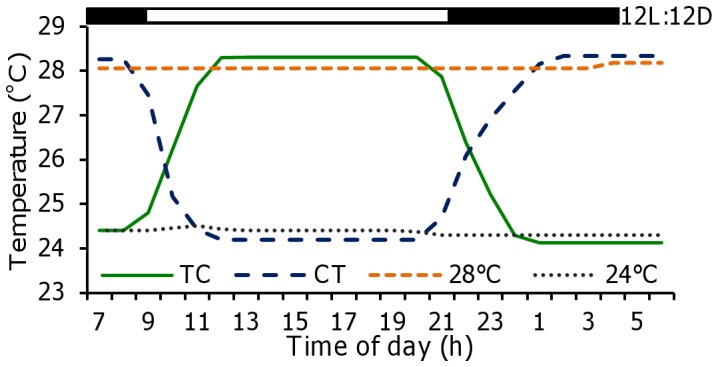
24:28°C thermophase:chryophase (TC), 28:24°C (CT) and constant treatments of 24°C and 28°C. The bar at the top represents the photocycle (12:12 LD).
Official websites use .gov
A
.gov website belongs to an official
government organization in the United States.
Secure .gov websites use HTTPS
A lock (
) or https:// means you've safely
connected to the .gov website. Share sensitive
information only on official, secure websites.
24:28°C thermophase:chryophase (TC), 28:24°C (CT) and constant treatments of 24°C and 28°C. The bar at the top represents the photocycle (12:12 LD).