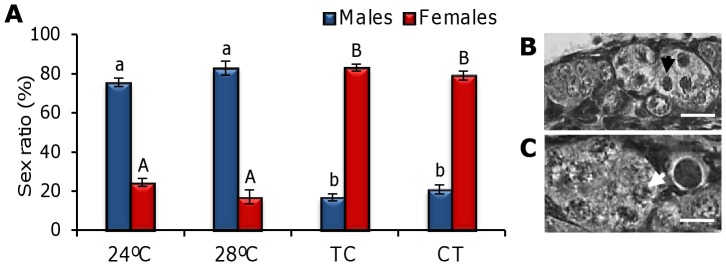
Figure 7. Sex ratio of zebrafish exposed to constant and cycling temperatures for 42 dpf.
Values are expressed as mean percentage of males or females obtained at 42, 90 and 150 dpf (A) (mean±SEM). Different letters indicate statistical differences in the percentage of males (lowercase) and females (uppercase) found among groups (P<0.05). Photos: developing male gonad (B) with spermatogenic cells (black arrowhead) and female gonad (C) with clusters of oogonia (white arrowhead). Scale bar: 20 µm. (N of each group: 24°C = 160, 28°C = 178, TC = 169 and CT = 136). Abbreviations as in Figure 1.

