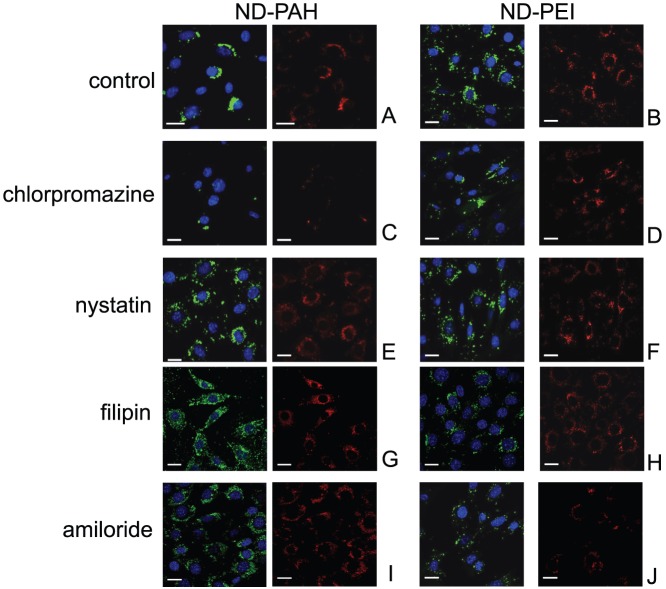
Figure 2. Study of the internalization pathways of siRNA-fND complexes in NIH/3T3 EWS-Fli1 cells, by fluorescence confocal microscopy.
All the cells were incubated at 37°C, with drugs inhibiting specific internalization pathways: (C, D) chlorpromazine, blocking the clathrin pathway; (E, F) nystatin or (G, H) filipin, blocking the caveola pathway and (I, J) amiloride hydrochloride, inhibiting macropinocytosis. (A, B): control cells incubated with cationic ND-siRNA complexes. Red channel: fNDs; green channel: FITC-labeled siRNA. Blue channel: DAPI labeling. Observations were carried out after the cells had been incubated for 4 h with 50 nM siRNA vectorized with either ND-PAH (left columns) or ND-PEI (right columns), at mass ratios of 1∶25 and 1∶75, respectively. Scale bars: 20 µm.

