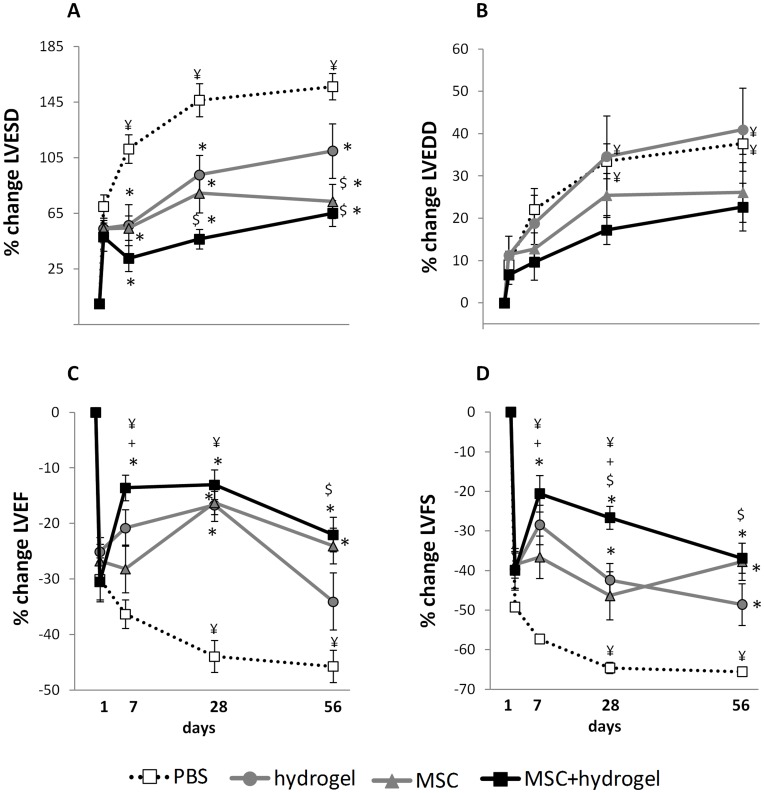
Figure 3. Evaluation of cardiac function by echocardiography in rats after myocardial infarction (MI).
Measurements were performed at baseline before MI and 1, 7, 28 and 56 days after MI as indicated. (A) Left ventricular end-diastolic diameter (LVEDD). (B) Left ventricular end-systolic diameter (LVESD). (C) Left ventricular fractional shortening (LVFS). (D) Left ventricular ejection fraction (LVEF). ¥ p<0.05 compared to day 1 post-MI in the same group, one-way repeated measures ANOVA.*p<0.001 vs. the PBS group at the same time-point, $p<0.05 vs. the hydrogel group at the same time-point and +p<0.05 vs. the MSC group at the same time-point, one-way ANOVA. All values represent mean ± SEM.

