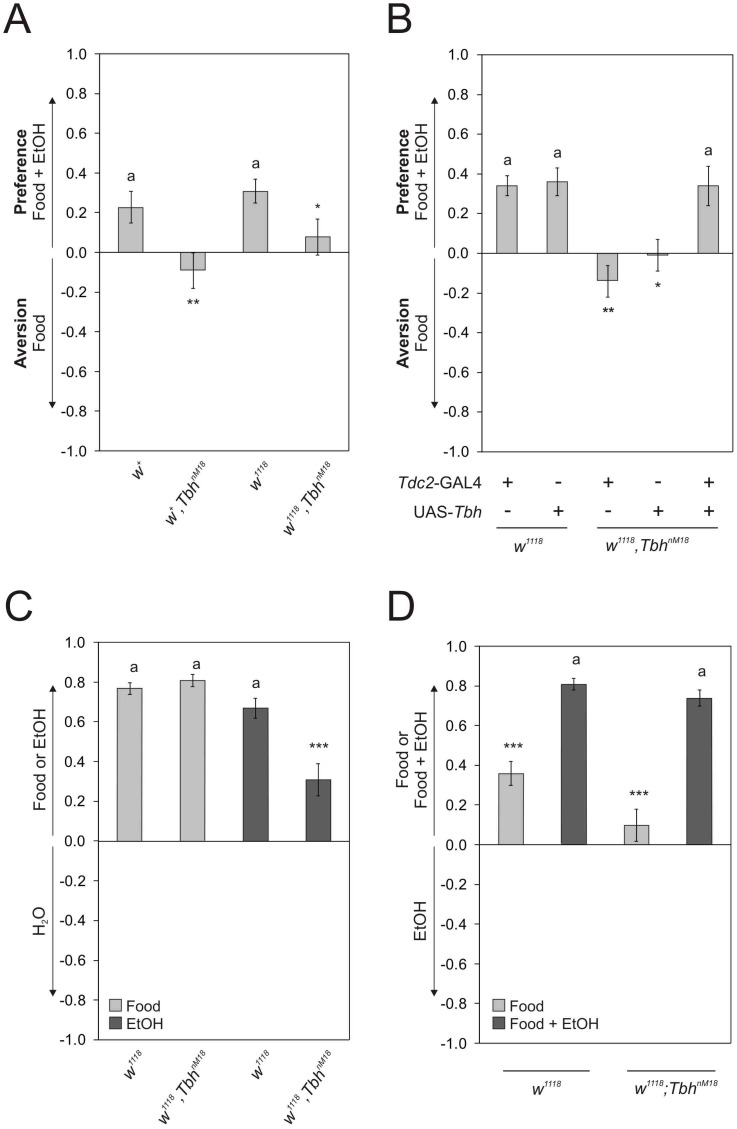
Figure 2. Ethanol preference depends on TbH function.
a TbhnM18 mutants do not show preference and differ significantly from controls (PIs are TbhnM18 0.09±0.09 and control 0.23±0.08. n 21 and 23. P<0.01). The loss of preference is independent of w1118 (PIs are w1118 0.31±0.06 and w1118, TbhnM18 0.08±0.09. n 26 and 17. P<0.05 and P<0.01). b Tdc2-GAL4 dependent expression of TbH in TbhnM18 mutants restores preference to control levels (PIs are w1118;Tdc2-GAL4/+0.34±0.05, w1118; UAS-TbH 0.36±0.07, w1118,TbhnM18;Tdc2-GAL4/+ −0.14±0.08, w1118,TbhnM18;UAS-TbH/+ −0.01±0.08 and w1118,TbhnM18;Tdc2-GAL4/UAS-TbH 0.34±0.1. n 21, 28, 23, 21 and 21.). Mutants carrying the transgenes insertions in the mutant background differ significantly from control carrying the respective transgene (P<0.05 and P<0.01). c TbhnM18 mutants prefer food odor over water similar to the controls (PIs are for w1118 0.77±0.03 and w1118, TbhnM18 0.81±0.03. n 18 and 15.) but do not prefer ethanol odor over water to the same extend as the controls (PIs are w1118 0.67±0.05 and w1118,TbhnM18 0.31±0.08. n 20 and 21. P<0.001). d Control flies prefer complex odors over the single odor ethanol (PI is w1118 0.36±0.06. n 35.) and increase their preference significantly for the complex odor when ethanol is added (PI is w1118 0.81±0.03. n 18, P<0.001). TbhnM18 flies show an increased preference for complex odors with ethanol over ethanol in comparison to the choice of complex odors without ethanol and ethanol (w1118,TbhnM18 0.10±0.08 and 0.74±0.04. n 24 and n 17. P<0.001). The letter a marks differences from random choice as determined by a One-sample sign test.

