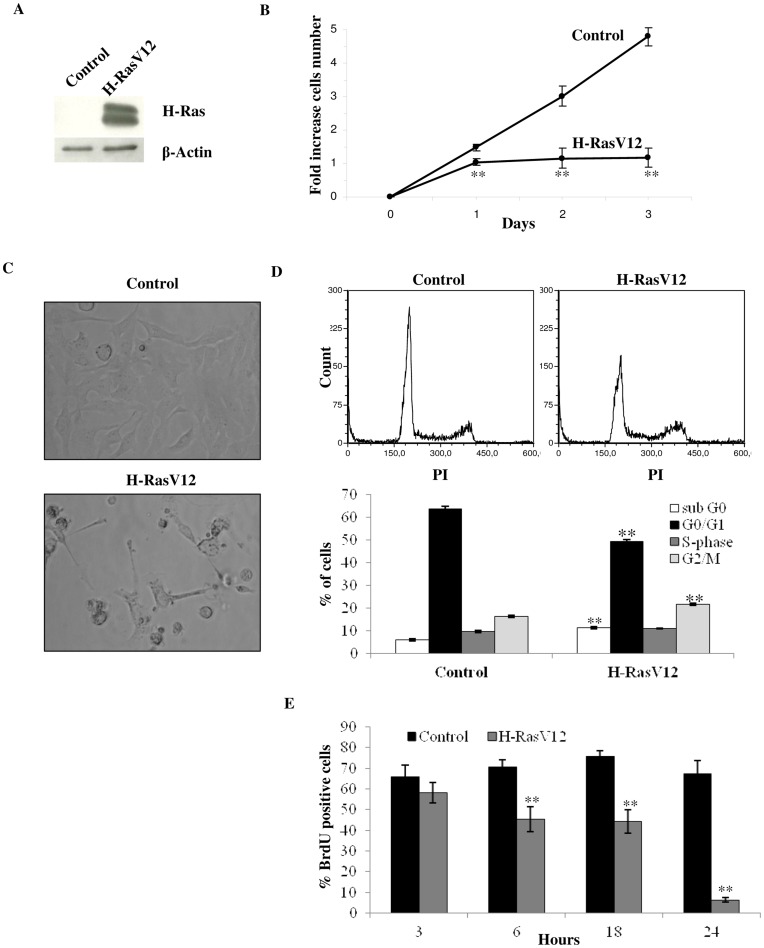
Figure 1. Analysis of cell growth and cell cycle.
A) Immunoblotting analysis of H-RasV12 transfected cells. Cell extracts were incubated with an anti-H-Ras antibody. As internal control an anti-β actin antibody was used. The increased expression of H-Ras in transfected cells compared to empty vector transfected cells (control) is shown. B) Growth curve of HuDe fibroblasts transfected with empty vector and H-RasV12. The cell number increase after the end of the selection with blasticidin-S (4 µg/ml) is reported. Mean values were calculated on 5 replicates and mean ± s.d. was indicated for each sample. C) Cell morphology analysis by light microscopy, 200× total magnification. D) Flow cytometry cell cycle analysis of transfected cells using PI (40 µg/ml) as probe. Percentage of fluorescent cells for sub G0, G0/G1, S and G2/M phases were reported in the bottom panel. Mean ± s.e.m. of three analyses is reported. E) Cell proliferation measured by BrdU incorporation in newly synthesized DNA using immunostaining and flow citometry analysis. Control and H-RasV12 transfected cells were treated with 40 µM BrdU for 30 minutes and analyzed after 3, 6, 18 and 24 h. Cells without BrdU were used as negative control according to the manufacture’s instruction. Values of the BrdU positive cells are given as mean ± s.e.m. of three independent experiments subtracting the relative negative control. **P<0.01.

