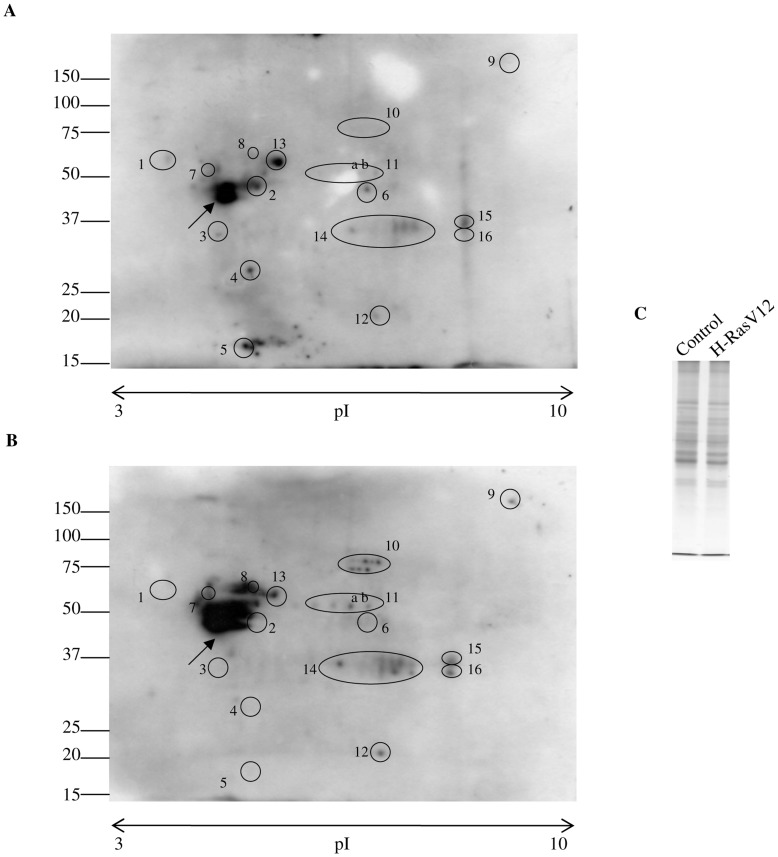
Figure 6. Evaluation of protein S-glutathionylation patterns.
Evaluation of protein S-glutathionylation patterns was performed by 2D-immunoblotting with anti-GSH antibody: A) control cells. B) H-RasV12 expressing cells. 100 µg of total cell extracts were separated on non- linear pH 3–10 strips (7 cm) for first dimension and then loaded on 10% acrylamide/bis-acrylamide gels for second dimension. Gels were blotted on PVDF membrane. Black rounds highlight protein spots which present a different level of S-glutathionylation. C) Total loading control. A total of 20 µg of cellular extract proteins used for 2D-immunoblotting was loaded on 10% acrylamide/bis-acrylamide gel and stained with Coomassie Blu.

