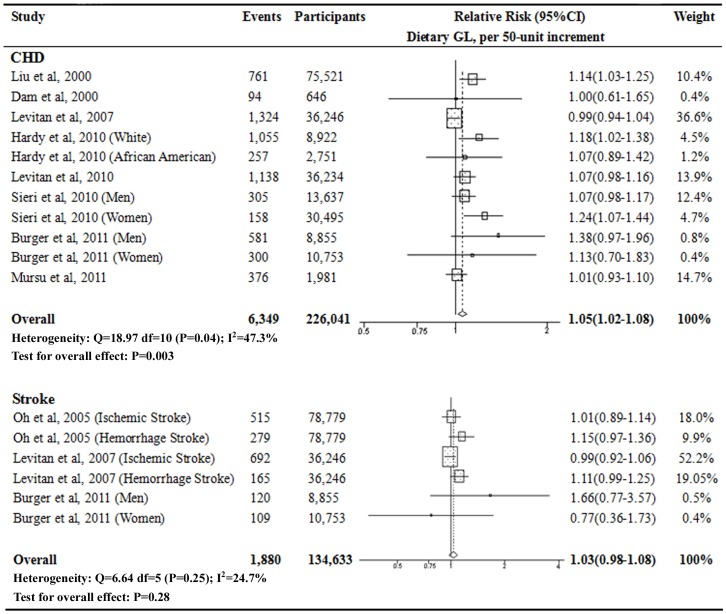
Figure 6. Relative risks of CHD and stroke by continuous dietary GL level.
The 2-stage generalized least-squares trend estimation (GLST) method [33] was used to evaluate the relative risks of CHD and stroke by continuous dietary GL level, which allowed combining the GLST-estimated study-specific slopes with the results from studies that only reported effect estimates for continuous associations. The per 50-unit increment in dietary GI level was approximately equivalent to the difference between the medians of the highest and the lowest categories of the included studies.

