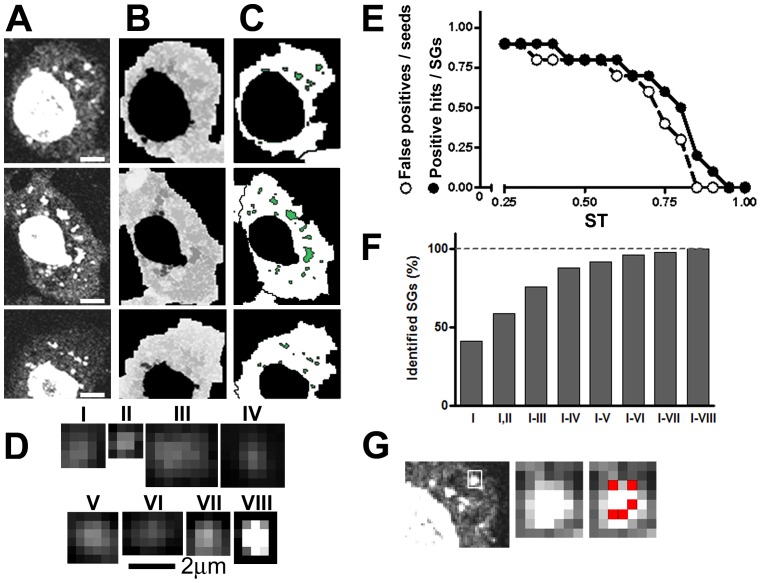
Figure 1. SGs in Drosophila S2R+ cells and script summary.
Cells were grown, treated and stained in 384 MW plates as indicated in Materials and Methods. A, B and C, Three representative cells are shown. A, The oligodT-Cy3 allows the visualization of SGs in the cytoplasm and of accumulated polyadenylated RNA in the nucleus. B, Merged image created by MATLAB before application of the Watershed transform algorithm for the identification of cell border and nucleus. C. Objects were identified as SGs by correlation with the selected prototypes using the MATLAB normxcorr2 function. D, Prototypes used to identify and analyze SGs. These were selected among 50 different examples to include differences in size, shape and intensity pattern. Size bar, 2 µm. E and F, A collection of 6 micrographs containing 125 cells with a total of 282 granules (see Table 1) were used to investigate the effect of varying the similarity threshold (ST) and of increasing numbers of prototypes. E, The proportion of false positives relative to the number of seeds and the proportion of positive hits relative to the manual-counted number of SGs was measured at different ST for the prototype IV, depicted in D. An ST of 0.85 allowed no false positives. SG recognition dropped from 80% to 20% at this ST value, and similar values were observed for the other prototypes (not shown). F, The number of positive hits that resulted by correlation with the indicated prototypes subsets was measured. All the SGs present in the micrographs were identified with the six prototypes depicted in D. Size bar, 5 µm. G, A representative SG from the cell in the first row showing the seeds (red) created by the script.

