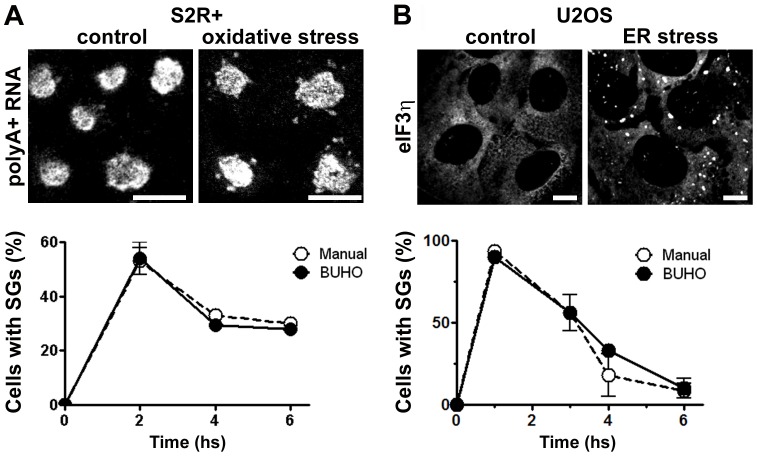
Figure 2. Time course of SG formation.
A, Drosophila S2R+ cells were exposed to oxidative stress and SGs were visualized by FISH. B, ER-stress was induced in U2OS cells and SGs were visualized by immunofluorescence of eIF3η. Confocal images (63×, 1024×1024 pixels) were analyzed manually or with BUHO with a scaling down to 512×512. Ten micrographs from triplicate wells (A) and 5 micrographs from duplicates (B) were analyzed at each time point. Error bars indicate standard deviation. Size bar, 10 µm.

