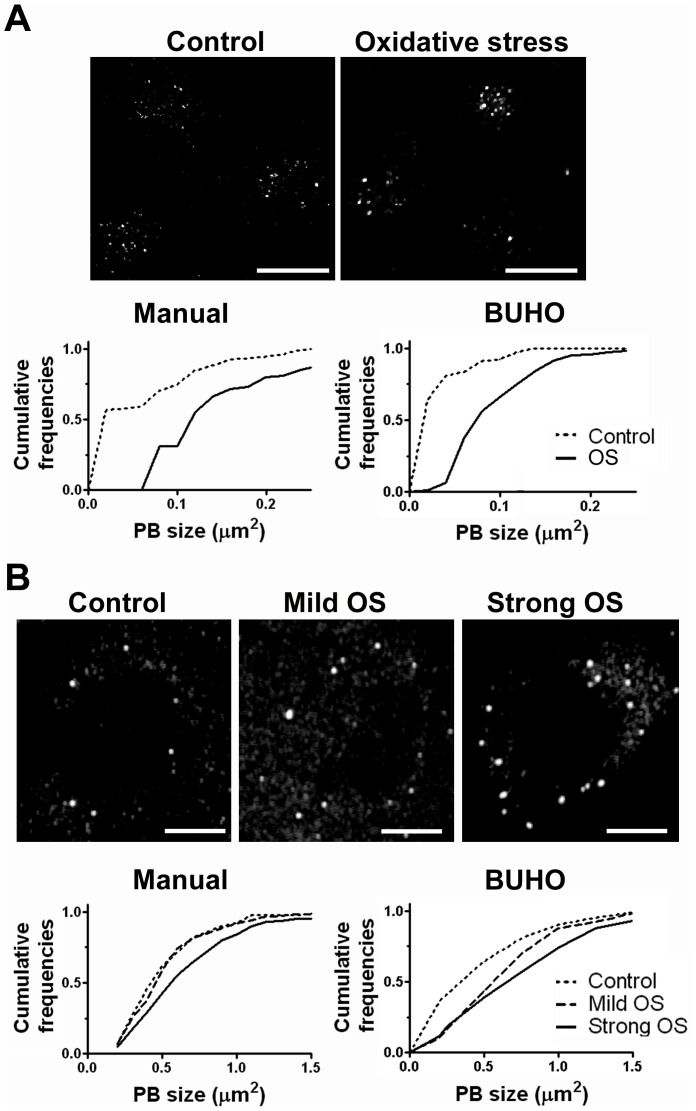
Figure 3. Analysis of PB induction by BUHO.
Fly (A) or mammalian cells (B) were exposed to oxidative stress as indicated in Materials and Methods and PBs were immunostained. PB size was evaluated using BUHO in 55 resting and 68 stressed S2R+ cells, and in 15 resting and 23 stressed U2OS cells, and by manual counting in 10 stressed or 10 resting S2R+ representative cells and 9 stressed and 9 resting representative U2OS cells. 63×, 1024×1024 (A) or 40×, 2048×2048 (B) confocal images were used. Size bar, 10 µm.

