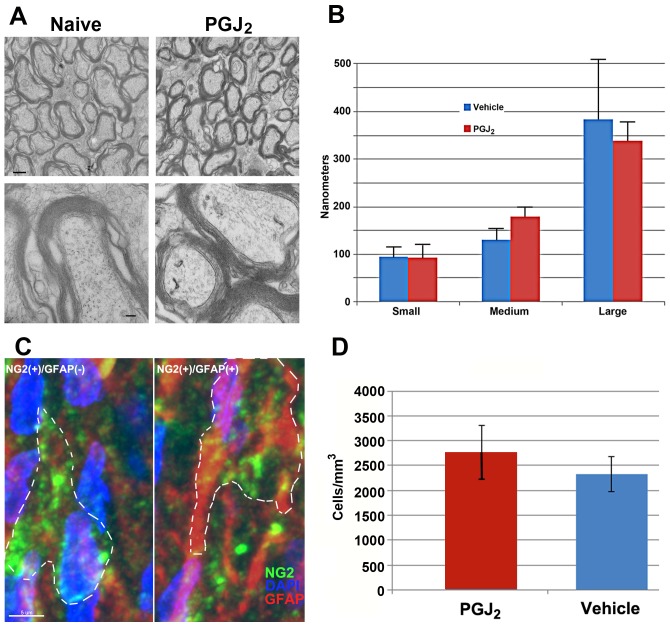
Figure 9. Oligodendrocyte- ultrastructural and -precursor analysis in vehicle- and PGJ2-treated ONs.
Animals were euthanized 30 days post-treatment and tissues prepared for either TEM (A and B) or immunohistochemistry (C and D) (see methods). A (top panels): low magnification of ON from either vehicle or PGJ2-treated animals. (bottom panels): High magnification of ON from vehicle- and PGJ2- (blue bars) treated animals. B. Myelin thickness graph from the ONs of vehicle- (red bars) and PGJ2- (blue bars) treated animals (Figure 9B). Axons from three distinct size group (small, medium, and large axons/group) were evaluated (n = 5 axons/group). Mean thickness is similar in each group for both conditions. Mean ±sd. C. Confocal analysis of NG2(+)/GFAP(−) (presumed oligodendrocyte precursors) and NG2(+)/GFAP(−) (Presumed astrocyte precursors) from the ON of a naïve animal. Both NG2(+) (Cy5 secondary label, seen in green)- GFAP(−) and GFAP(+) (Cy3 secondary label, seen in red) cells are scattered throughout the ON in naïve- and PGJ2- treatment groups. D. Stereological analysis of NG2 expressing cells in vehicle- and 30 day post-PGJ2 treated ONs (n = 5 nerves/group) showed similar numbers of NG2(+)/GFAP(−) cells per unit volume. p>0.05, Mann-Whitney U test.

