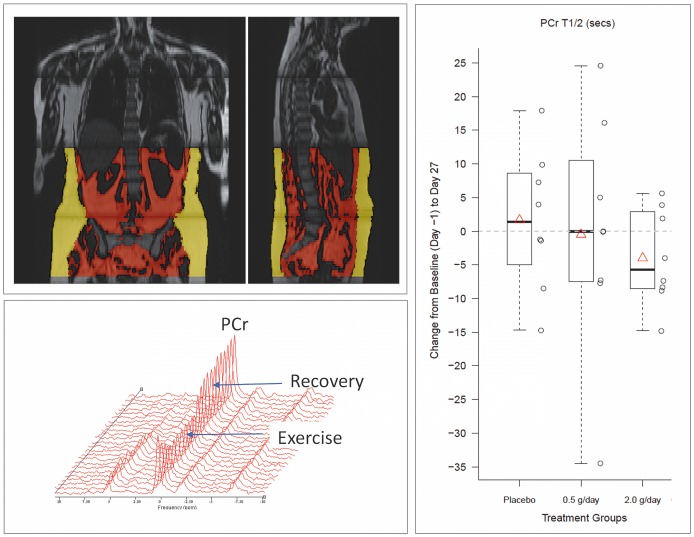
Figure 6. Representative example of magnetic resonance images and 31P Magnetic resonance spectroscopy results.
Top left panel: intra-abdominal (red) and subcutaneous (yellow) adipose tissue maps overlaid on coronal and sagittal body MRI images from a single subject. Bottom left panel: dynamic series of 31P MRS spectra acquired serially during exercise and recovery from a single subject as described in Methods. Right panel: box plot of PCr recovery time change from baseline (day −1) to day 27 for the placebo, SRT2104 0.5 g/day and 2.0 g/day groups.

