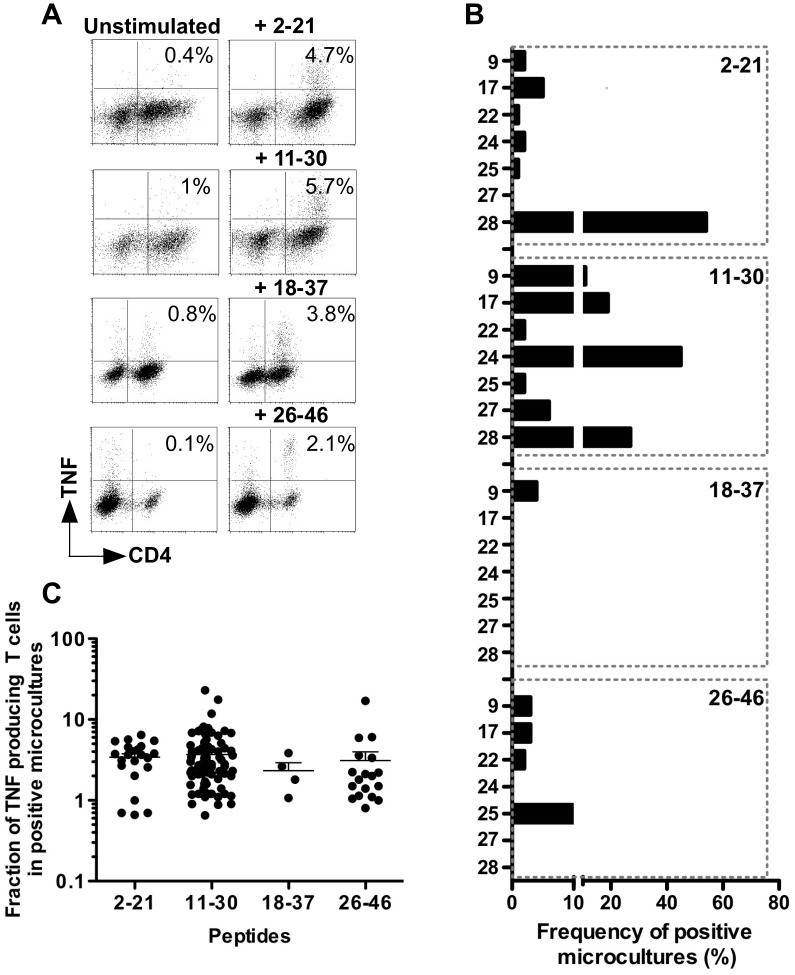
Figure 3. MELOE-1 specific responses in healthy donors.
(A) Dot plot illustrating peptide-specific TNF responses, in MELOE-1 stimulated microcultures from HD9 and HD28. Fourteen days after PBMC stimulation with MELOE-1 whole polypeptide (2–46), microcultures were re-stimulated or not with each indicated peptide during 5 h. Reactivity was then assessed by double staining TNFα/CD4. Percentages indicate the fraction of TNF producing T cells, among CD4 T cells. (B) Frequency of microcultures containing CD4 T cells specific for MELOE-1 peptides. A microculture was considered as positive when the fraction of TNF producing T cells was 2-fold higher upon peptide stimulation than in unstimulated cultures. (C) Percentages of TNF-α producing CD4 T cells upon peptide-stimulation, in positive microcultures from all donors.

