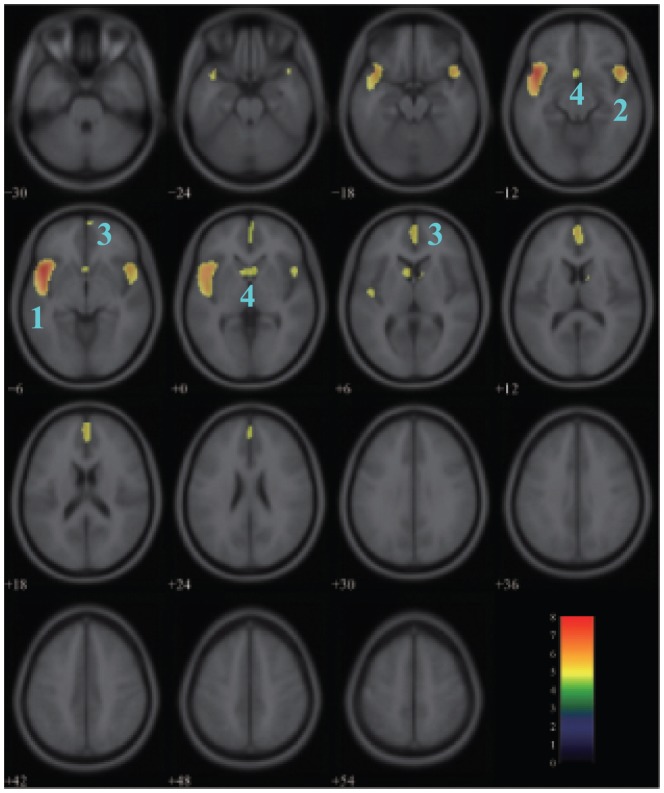
Figure 3. Areas of negative correlation between glucose metabolism and age in the male group.
The significant areas overlaid on a T1-weighted MRI image are displayed with a statistical threshold of  FWE-corrected and an extend threshold of 100 voxels. The number of slices correspond to the z values in Talairach coordinate system which defined form inferior to superior. Clusters 1–4 represent the left superior temporal gyrus, the right superior temporal gyrus, the medial frontal gyrus, and the caudate
 left subcallosal gyrus respectively. Color scale denotes
  value.

