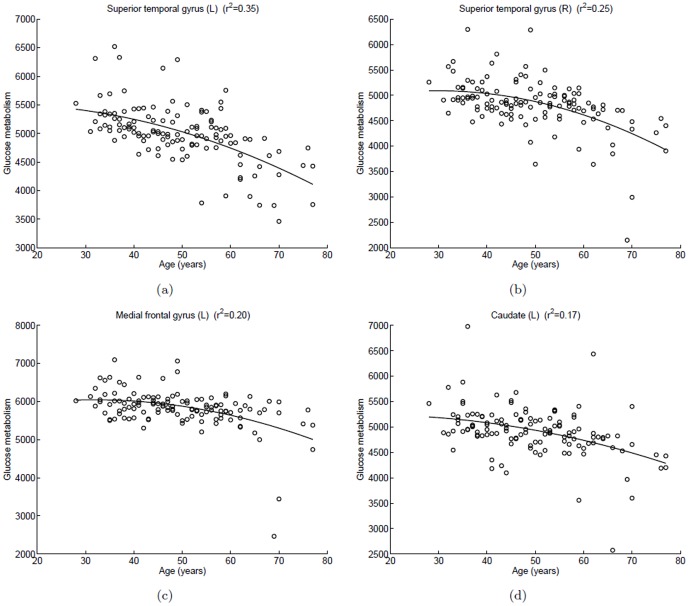
Figure 4. Scatterplots of glucose metabolism in local maximum of each cluster versus age in the male group (negative correlation).
A quadratic polynomial fitting is used to express the relationship between glucose uptake and age. (a) Left superior temporal gyrus,  ; (b) Right superior temporal gyrus,
  ; (c) Left medial frontal gyrus,
  ; (d) Left caudate,
  .
.

