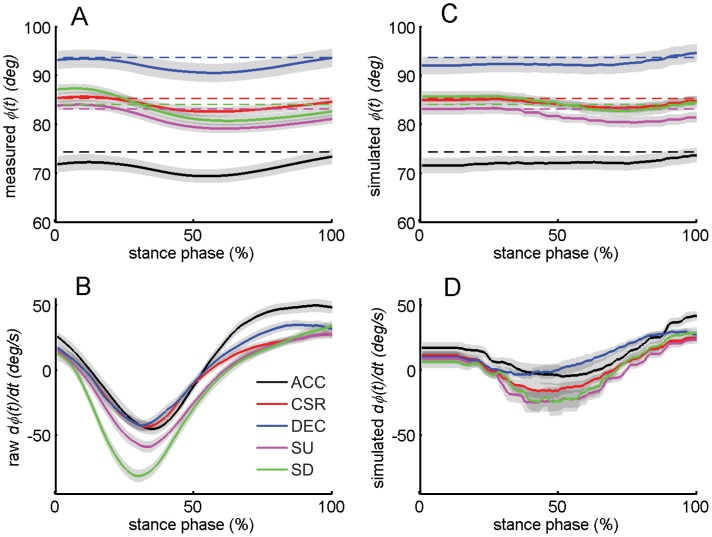
Figure 6. Relationship of hip moments to body orientation.
Measured body pitch angle ϕ(t) (A), and angular speed  (B) during stance. Line colors corresponded to the tasks (Black: ACC; red: CSR; blue: DEC; magenta: SU; green SD). For ϕ(t) the reference angles ϕd from each task are indicated by the dashed horizontal lines. Pitch angle ϕ(t) (C) and angular speed
  (D) predicted by Eq. 2 in stance. Each trial was simulated from the initial conditions of ϕ and
  at TD. For each participant the simulation was implemented under ode45 function of MATLAB
  . J is the pitch moment of inertia of the upper extremities relative to the hip in the sagittal plane. Mg is the moment relative to hip caused by the upper body’s COM, and Macc is the moment relative to the hip caused by the acceleration of upper body’s COM in the sagittal plane. For each participant all trials within each task were averaged, then averaged across all participants within a task. Shaded areas indicate mean±s.e.m.

