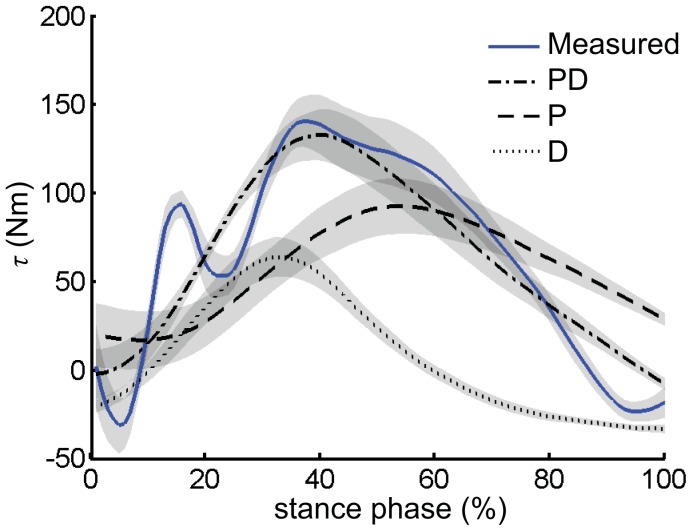
Figure 7. Comparison between measured hip moments and predicted hip moments.
Measured hip moment was calculated as the sum of both legs’ hip flexion/extension moments (blue solid). τ (PD, dash and dotted) was predicted by (Eq. 2). P (dashed) is the proportional portion of τ, while D (dotted) is the derivative component of τ. Measured hip moment, τ, P, and D were first averaged from all trials within each task for each participant, and then averaged across all participants and tasks. Shaded areas are mean±s.e.m.

