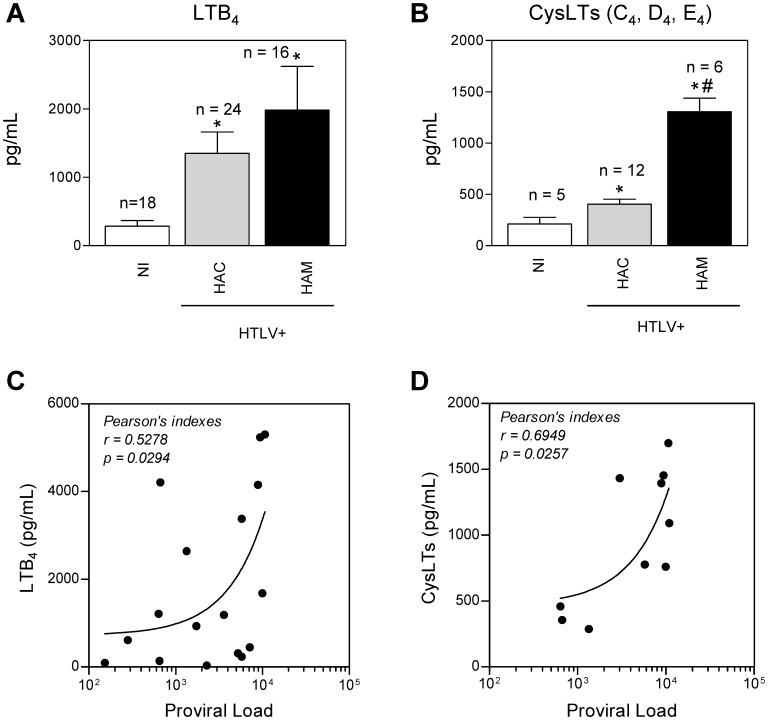
Figure 1. Leukotrienes are increased in the plasma of HTLV-1-infected subjects and correlate with the proviral load.
LTB4 (A) and CysLTs (B) were measured by EIA after sample purifications on Waters C18 Sep-Pak cartridges. Plasma from non-infected healthy donors (NI), HTLV-1 asymptomatic carriers (HAC) and HAM/TSP subjects (HAM) were used. (C, D) A correlation is shown between the plasma levels of LTB4 (C), CysLTs (D) and the DNA proviral load in peripheral blood mononuclear cells of HTLV-1-infected individuals (HAC and HAM/TSP) using Pearson rank correlation test. The data are presented as means ± SEM. *p<0.05, compared with control; # p<0.05, compared with HAC (one-way ANOVA). Statistically significant correlations at p<0.05 are displayed in the graphs along with Pearson’s coefficient (r).

