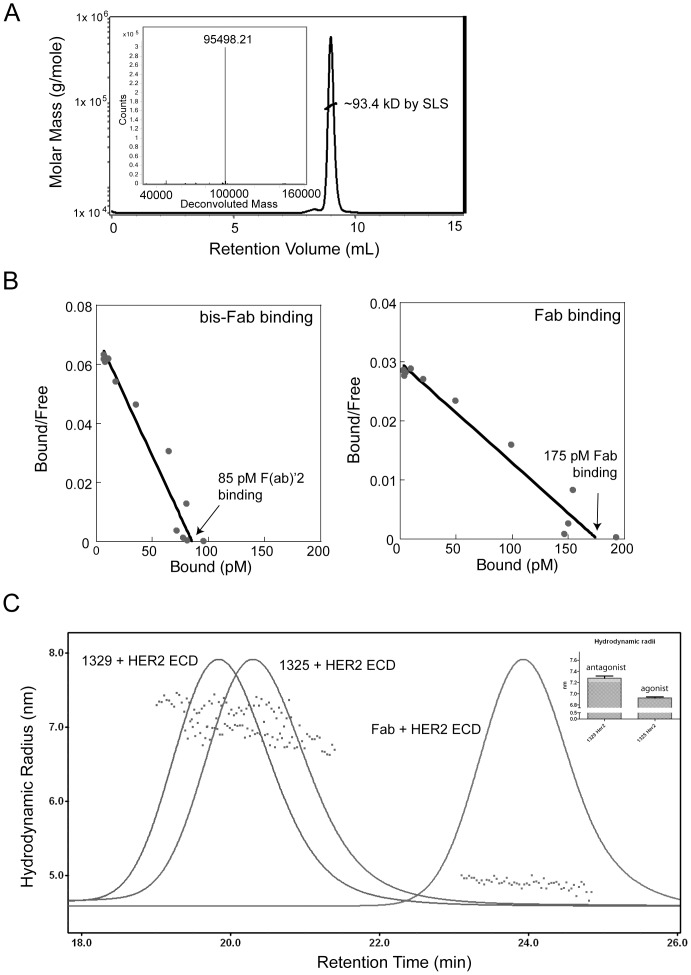
Figure 3. Quantitative analyses of bis-Fab biophysical and biochemical properties.
(a) Bis-Fabs were analyzed for purity and aggregation using mass spectrometry and size exclusion chromatography (SEC). Shown here is a representative size exclusion chromatogram and mass spectrum for a bis-Fab, number 1325. The line across the major peak on the SEC indicates the molecular weight determined by static light scattering (SLS), around 93.4 kD. (b) To determine if bis-Fabs are binding with one Fab domain or two Fab domains to the cell surface, we performed Scatchard analysis using BT474 cells and radiolabeled bis-Fabs. All bis-Fabs showed cell surface affinities similar to that of the parent antibody trastuzumab, binding to two receptors per mole of bis-Fab. The data for number of receptor binding sites and affinity are shown here for both a representative bis-Fab and a single trastuzumab Fab domain. (c) Both an agonist and antagonist bis-Fab, 1329 and 1325, respectively, were bound to the receptor ECD in solution and analyzed by size exclusion chromatography coupled to a static light scattering detector. The complexes were analyzed by light scattering to determine the overall hydrodynamic radii, and an average of multiple measurements are shown in the histogram inset. The agonist complex had a radius slightly, but statistically significantly, smaller that the antagonist complex.

