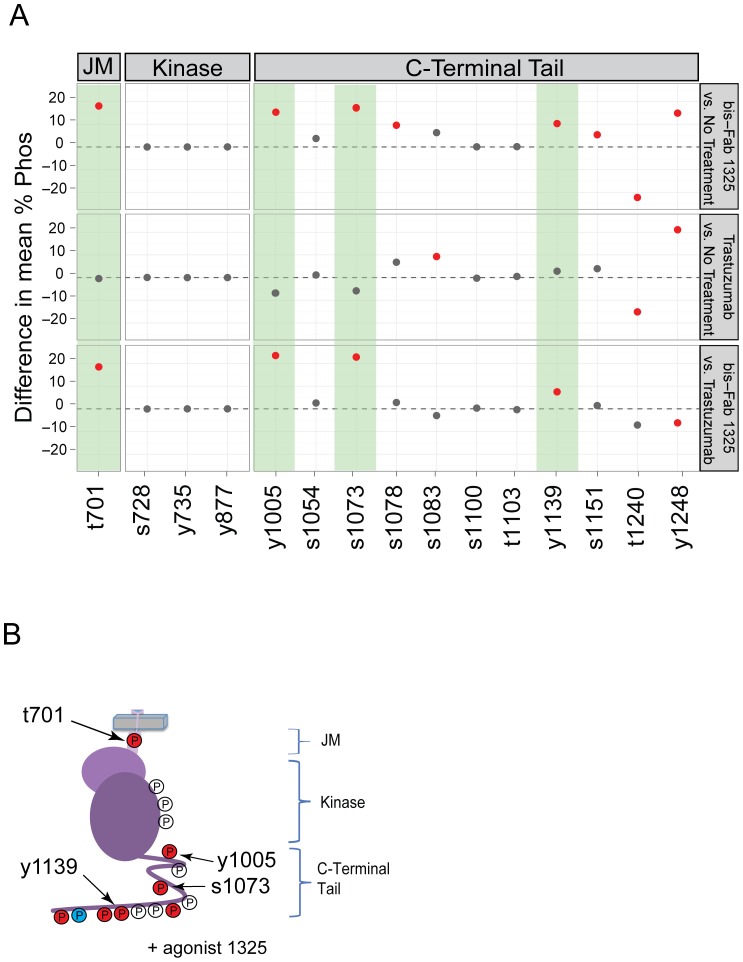
Figure 5. Changes in HER2 phosphorylation are associated with agonist activity.
(a) This panel compares phosphorylation differences at fifteen sites in HER2 after treatment with either the agonist bis-Fab 1325 or trastuzumab. The top panel shows differences between agonist treatment and no treatment (basal phosphorylation). Seven of the sites showed statistically significant increases in phosphorylation (red dots above the line), five sites showed no change, and one site decreased. The same comparison is made between trastuzumab (antagonist) and no treatment shown in the second panel. A third comparison is made between bis-Fab 1325 and trastuzumab. Here, sites that show statistically significant differences between the treatments are indicated by red dots. Those phosphorylation sites that are significantly higher than trastuzumab treatment are highlighted with green background. The results were analyzed with a Tukey-Kramer all-pairwise test and the error bars indicate the 95% confidence level. Methods used are described in detail in the Supplementary Information. Figure S5 shows the raw data consisting of nine mass spec measurements for each treatment and phosphorylation site. Red color is used to indicate a statistically significant difference between the two samples with a P-value of <0.05. (b) This illustration of the HER2 intracellular domains shows phosphorylation sites identified by mass spectrometry. Phosphorylation sites colored orange denote sites with measureable increases, blue for decreases and uncolored for no change after agonist bis-Fab 1325 treatment. Phosphorylation sites that are significantly higher in agonist treatments compared to trastuzumab treatments are indicated by arrows.

