
Figure 8. Biophysical characteristics of the IA current.

A perforated patch on a P3 SN neuron that was later identified as a DA neuron. (A) I–V currents obtained with the same voltage-pulse protocol used in figure 3A. A small correction was used to account for a small difference in leak current. Voltage as indicated, the traces at 40 and 80 mV were excluded for clarity. (B) Fit to the currents on A was performed using a voltage-clamp simulator and solving Hodgkin-Huxley equations. (C) Inactivation parameters as a function of voltage. Open triangles, inactivation function, left ordinate. Closed triangles, time constant, right ordinate. The inactivation form was fit with a function of the form, 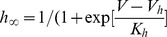 , with
 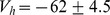 , and
, and  (units in mV). The function to fit the time constant was
 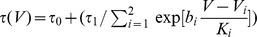 with
with  ms,
ms,  ms,
ms,  , and
, and  (units in mV),
  . This function is shown as the fit to the closed circles with right ordinate. Identical fits were carried out at P0, P2 and P5, with similar results for activation and inactivation parameters. For P0, the activation and inactivation parameters were
 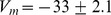 , and
, and  (Activation) and
  , and
, and  (Inactivation). (D) Activation parameters as a function of voltage. Open circles, activation function, left ordinate. Closed circles, time constant, right ordinate. The m4 activation data was fit to the function
 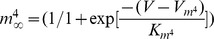 , with values (mV),
  , and
, and  . This function is shown as the fit to the open circles with left ordinate. The m activation is shown as a dashed line with the following parameters,
  (units in mV). The time constant was fit with the same functional form as the one used for inactivation, with
  ms,
ms,  ms,
ms,  , and
, and  (units in mV),
  . This function is show as a fit to the closed circles with right ordinate.