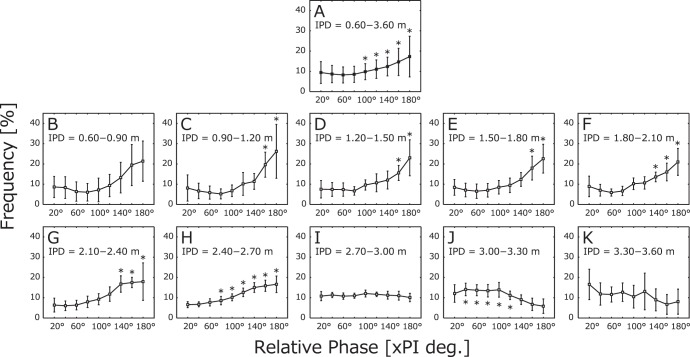
Figure 3. Frequency of relative phase at each interpersonal distance.
The frequency of relative phase per 0.30 m was calculated for each match, and the averages and standard deviations are indicated. A. Total frequency at all distances (0.60–3.60-m). B–K. Partial frequencies at each distance (0.60–0.90 m, 0.90–1.20 m,... 3.30–3.60 m). Relative phases were divided into nine ranges (20°: 0–20°, 40°: 20–40°,... 180°: 160–180°). The black asterisks (*p<.05) above the line indicate distances that were significantly more frequent than were those at 20° and/or 40°, and the asterisks below the line indicate distances that were significantly more frequent than those at 160° and/or 180°.

