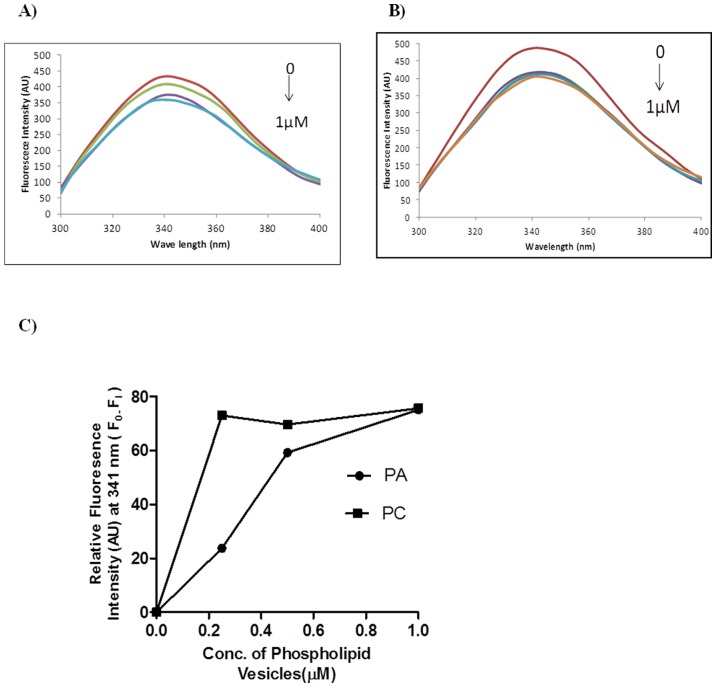
Figure 7. Binding of phospholipid vesicles to CaCDPK1.
Fluorescence emission spectra of CaCDPK1 were recorded in the absence and the presence of increasing concentration of small unilamellar vesicles composed of PA (A) and PC (B). Samples were incubated in 50 mM Tris-HCl, pH 7.2,150 mM NaCl and 1 mM CaCl2, and titrated with increasing concentration of PA (red: CaCDPK1 alone; green: 0.25 µM; purple: 0.5 µM; blue: 1 µM) and PC (red: CaCDPK1 alone; blue: 0.25 µM; purple: 0.5 µM; orange: 1 µM). Samples were excited at 280 nm and the emissions from 300 to 400 nm were recorded. Excitation and emission slits were set at 5 nm. Care was taken to avoid inner filter effect or scattering. C) A re-plot of A and B showing change in fluorescence intensity at 341 nm as function of phospholipid vesicle concentration.

