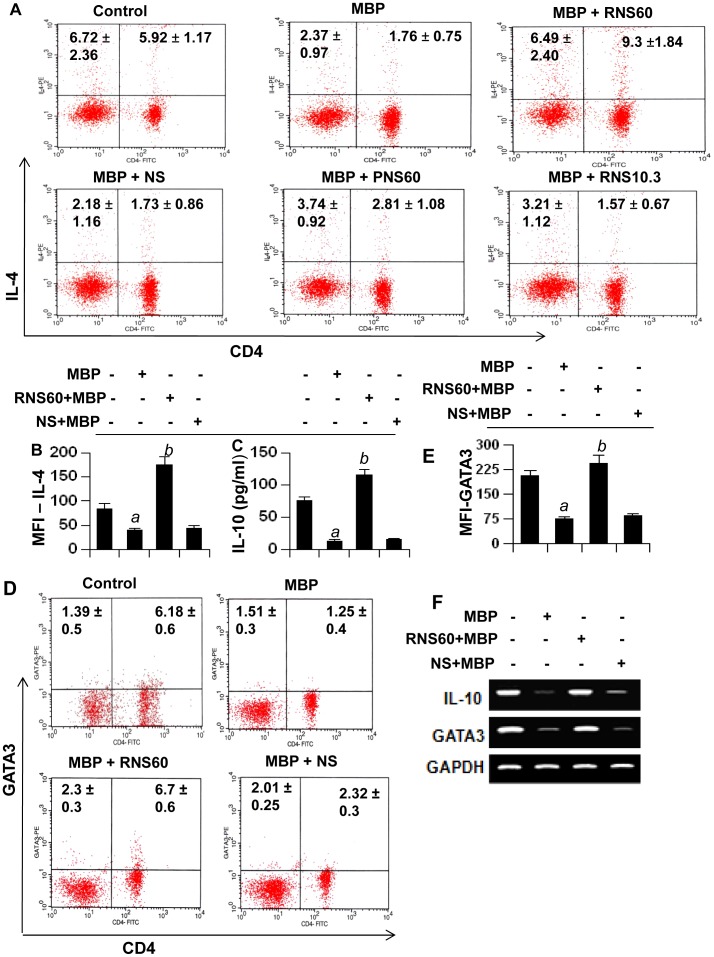
Figure 6. Regulation of Th2 cells by RNS60, NS, PNS60, and RNS10.3.
LNC isolated from MBP-immunized donor mice were stimulated with MBP in the presence of 10% v/v of RNS60, NS, PNS60, or RNS10.3. A) After 72 h of stimulation, T cells were incubated with appropriately diluted PE-conjugated anti-CD4 and FITC-conjugated anti-IL-4 Abs followed by FACS analysis. The percentage of relevant cells is indicated in their respective their respective quadrants. B) The mean fluorescence intensity (MFI) of IL-4 in CD4+ population was calculated by using CellQuest software. C) Supernatants were assayed for IL-10 by ELISA. Data are mean ± SD of three different experiments. ap<0.001 vs control; bp<0.001 vs MBP. D) LNC isolated from MBP-immunized donor mice were stimulated with MBP in the presence or absence of RNS60 (10% v/v) and NS (10% v/v), respectively followed by FACS analysis with appropriately diluted PE-conjugated anti-GATA3 and FITC-conjugated anti-CD4 Abs. The percentage of relevant cells is indicated in their respective quadrants. E) The MFI of GATA3 in CD4+ population was calculated by using CellQuest software. Data are mean ± SD of three different experiments. ap<0.001 vs control; bp<0.001 vs MBP. F) LNC isolated from MBP-immunized donor mice were stimulated with MBP in the presence or absence of RNS60 or NS, for 48 h followed by monitoring the mRNA expression of IL-10 and GATA3 by semi-quantitative RT-PCR. Results represent three independent experiments.

