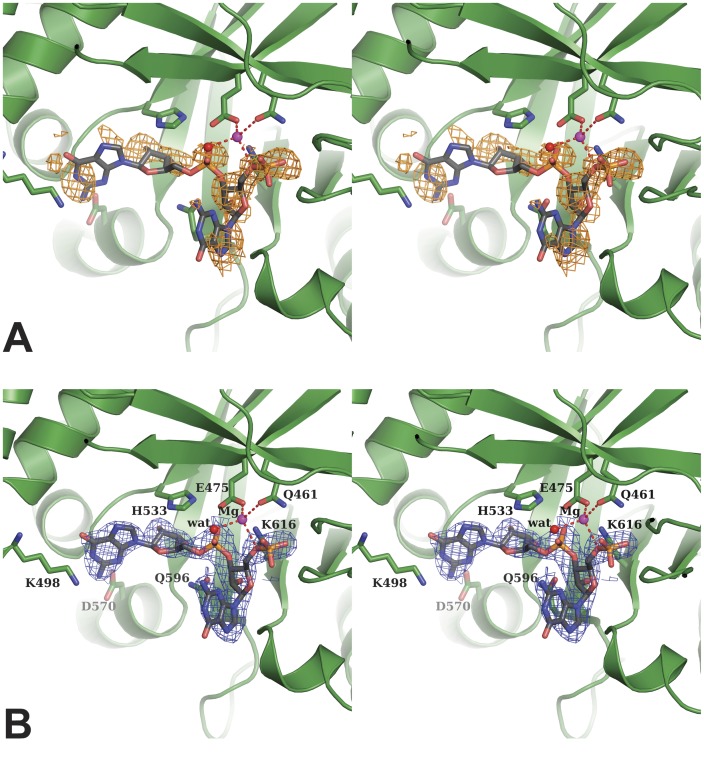
Figure 2. Stereo view of the active site of FimX-EAL domain.
(A) The residual density Fo-Fc calculated after molecular replacement with no ligand in the model is contoured in orange at 3 σ level (A). The FimX backbone is represented as green cartoon. (B) Interpretation of the density as the bound 5′-pGpG, shown as black sticks. The magnesium ion is shown as a magenta sphere and the catalytic water involved in its coordination as a red sphere. Side-chains of residues involved in ligand binding are shown. The final electron density map 2Fo-Fc contoured at 1.2 σ level is traced around the ligand.

