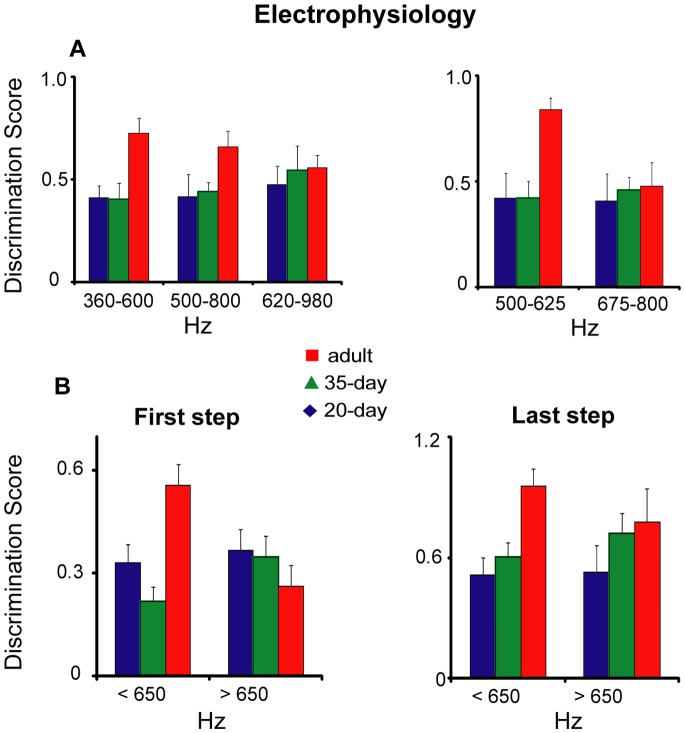
Figure 4. Neural discrimination gradients as a function of age and frequency range.
(A) Discrimination scores averaged across all frequencies within each frequency range (left panel) and separately for test stimuli below versus above the habituating stimulus for the experiment in which birds were habituated to a call of 650 Hz and tested with calls from 500–800 Hz. (B) Discrimination scores at the first and last frequency steps within the high (675–800 Hz) versus low (500–625 Hz) frequency ranges. All scores plotted as mean ± SEM.

