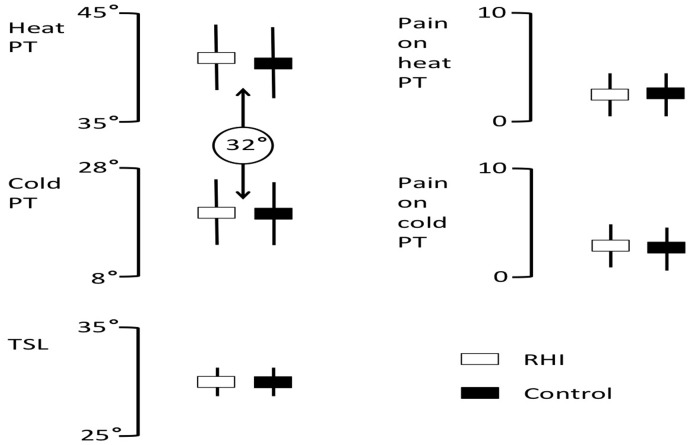
Figure 4. Experiment 2 results: Mean (rectangle) and standard deviation (error bars) heat pain threshold (HPT), cold pain thresholds (CPT) and thermal sensory lymen (TSL) in °C for the rubber hand illusion (rubber hand illusion; open shapes) control conditions.
Right panels show pain ratings on a 0–10 scale for the pain experienced for the threshold stimuli for heat pain threshold and cold pain threshold condition. The circled 32° reflects the baseline from which a ramping stimulus was used to determine both heat PT and cold PT.

