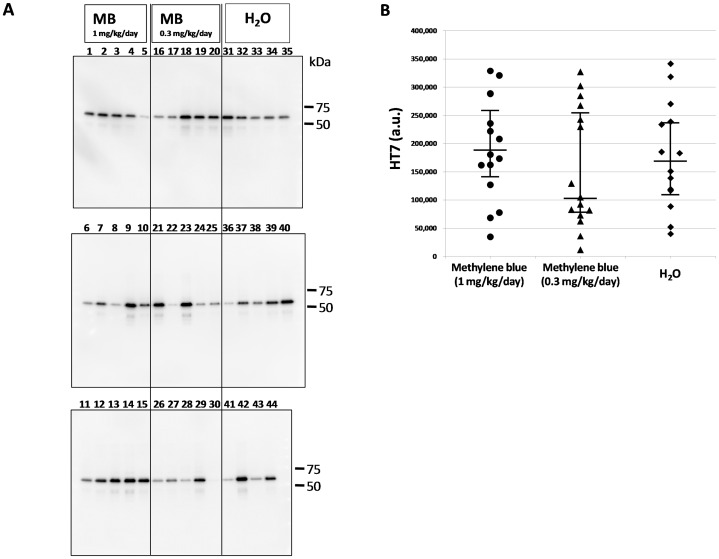
Figure 3. Immunoblotting analysis of total tau in the sarkosyl-insoluble fraction.
(A) Immunoblot analysis was visualized using HT7 antibody for the sarkosyl-insoluble fraction. The numbers indicate individual mice: 1–15, MB 1 mg/kg/day group; 16–30, MB 0.3 mg/kg/day group; 31–44, water only group. Molecular weight markers are shown on the right (kDa). (B) A comparison of relative total tau (HT7) expression levels in the sarkosyl-insoluble fraction of the MB-treated groups and the water only group. The data were compared with the HT7 band intensity. The central lines indicate medians and the vertical lines represent 25th and 75th percentiles. a.u., arbitrary unit.

