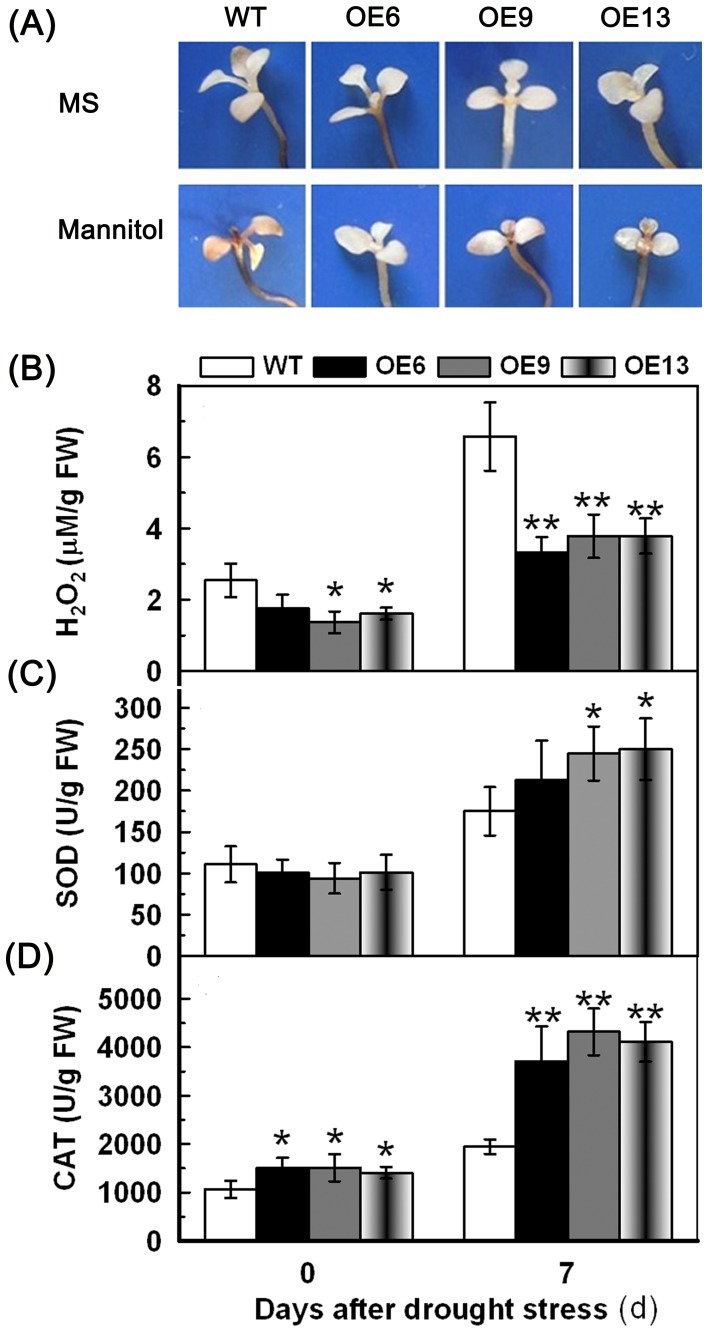
Figure 8. Analysis of H2O2 accumulation, SOD and CAT activities in transgenic lines under osmotic stress.
The WT and transgenic lines were cultured in MS medium under a 16 h light/8 h dark cycle at 25°C for one week, and then the seedlings were transplanted to MS or MS with 300 mM mannitol for one week. The whole seedlings were used to detect H2O2 accumulation, SOD and CAT activities. (A) In situ detection of H2O2 by DAB staining of WT and transgenic seedlings. (B) H2O2 content. (C) SOD activity. (D) CAT activity. Vertical bars indicate ±SD calculated from four replicates. Asterisks indicate significant difference between the WT and the three transgenic lines (*p<0.05; **p<0.01). Three biological experiments were performed, which produced similar results.

