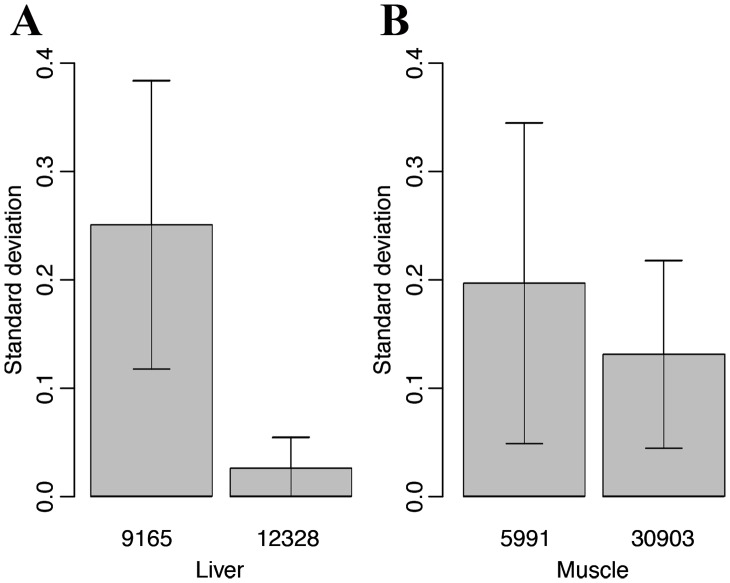
Figure 3. Antisense expression associates with larger gene expression variability.
The histograms (A) and (B) show the gene expression variability of transcripts with and without antisense expression in liver and muscle, respectively. The X-axis indicates the sample number and the Y-axis shows the standard deviation of gene expression levels.

