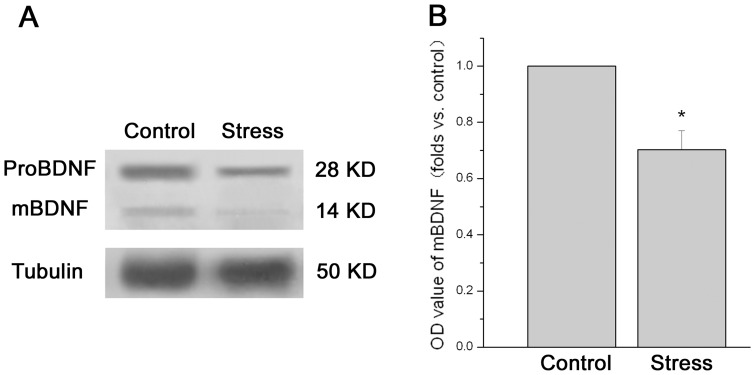
Figure 4. The effect of chronic stress on the ovarian BDNF detected by western blotting.
Data (mean ± SEM) (n = 9) are shown as folds vs. control group. Figure 4A shows a representative western blot of ovarian BDNF. The predominant bands of 28 kD represent proBDNF, and the faint bands at 14 kD represent mature BDNF (mBDNF). Figure 4B shows the relative quantitative level of mBDNF protein. * P<0.05 vs. control group.

