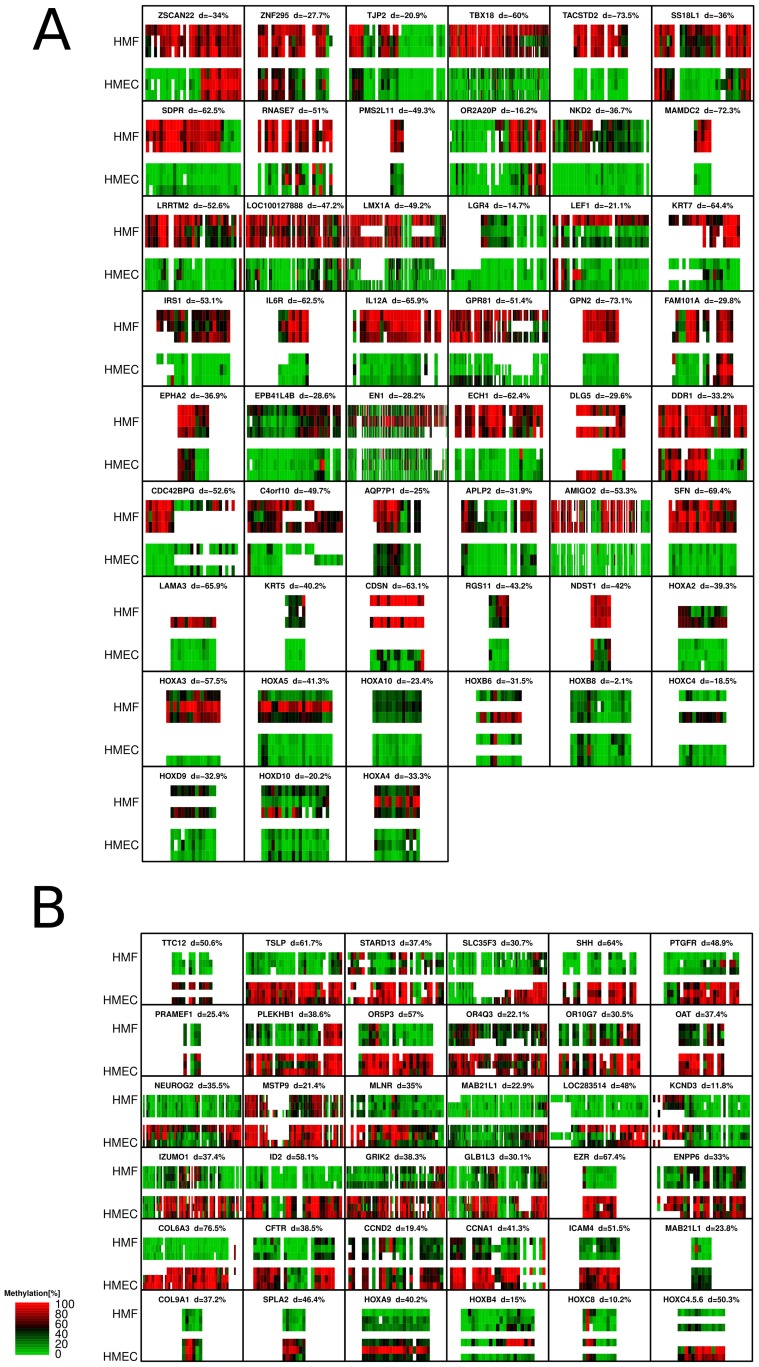
Figure 1. Validation of microarray results using MALDI-TOF mass spectrometry (MassARRAY).
CtDMRs are labeled by the gene symbol of the closest gene. Each ctDMR is shown as a heatmap; methylation level for each informative CpG fragment is shown in columns and analyzed samples are organized in rows. Each colored rectangle corresponds to 1 CpG unit. All three genotypes were analyzed. White spaces are shown when the quality of data was not sufficient to assess methylation. A) ctDMRs which are methylated in HMF according to microarray. B) ctDMRs which are methylated in HMEC according to microarray. A more detailed view for each analyzed region is included in Information S1.

