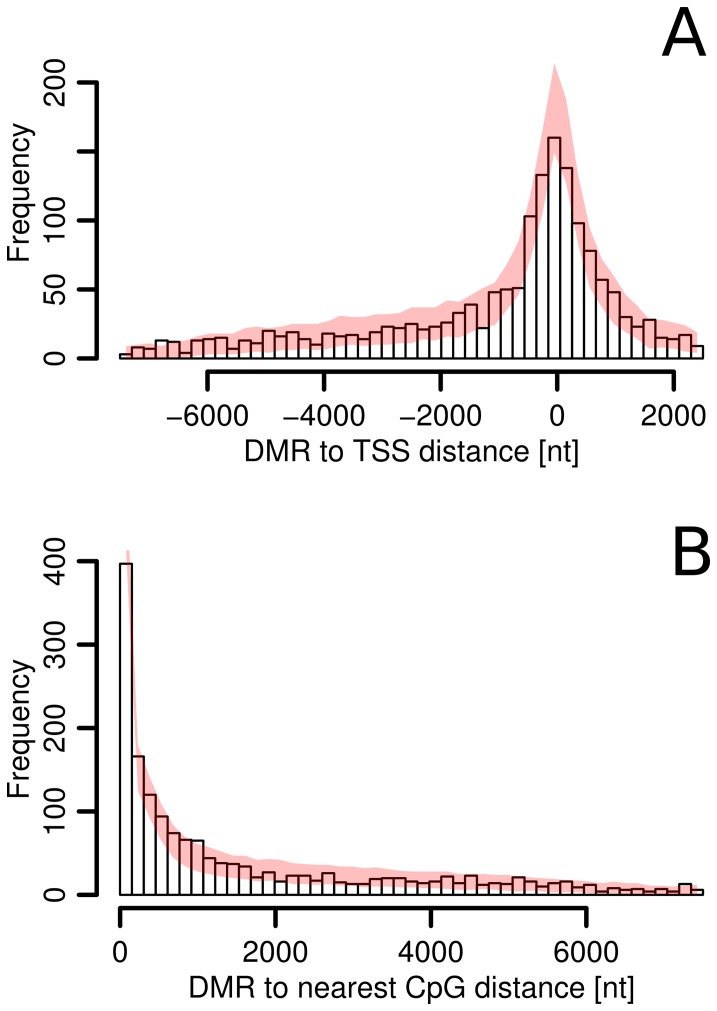
Figure 2. Distribution of ctDMRs.
A) Position of ctDMR relative to TSS. Negative and positive distances correspond to sequences upstream and downstream to TSS, respectively. B) Position of ctDMR relative to the nearest CpG island. For both charts, pink lines show the expected distribution if DMRs have random localization and uneven microarray coverage is taken into consideration. 99% confidence interval based on the simulation is shown.

