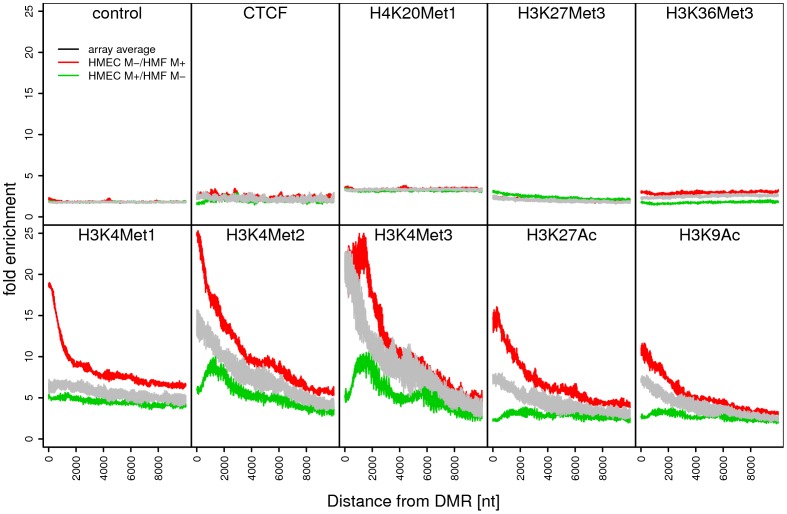
Figure 3. Average histone modifications in post-stasis post-selection HMEC in regions proximal to ctDMRs.
For each group of ctDMRs, the signal enrichment from ChIP-Seq experiment performed on post-stasis HMEC was analyzed [35], [36]. All data points were grouped and a moving average along the distance from each ctDMR is shown. The microarray average was calculated from the same number of regions as ctDMR but randomly placed in the genome according the array coverage. Control profile is derived from input DNA signal of a chip-seq experiment. M+ = hypermethylation; M- = hypomethylation.

