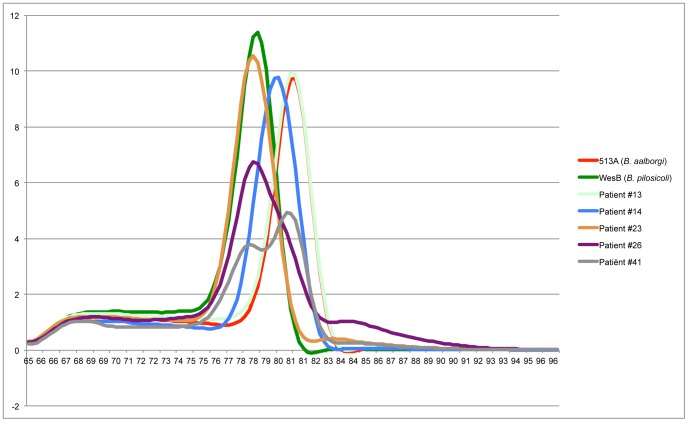
Figure 2. Example of the melting-curve analysis.
There is a clear difference in melting-temperature between the type-strain of B. pilosicoli and B. aalborgi. Biopsy samples containing these species fall neatly within these graphs (patients #13 and #23). “B. hominis” (patient #14) is visible as a peak between the type strains, indicating a different base-pair composition. The double infection (patient #26) begins as a B. pilosicoli-peak with a clear shoulder under the “B. hominis” peak, indicating that two different DNA molecules are present, each with a different melting-temperature-peak. The triple infection (patient #41) is displayed here by the biopsy sample that had both a B. pilosicoli and a B. aalborgi, another biopsy sample taken from this patient at the same time indicated an infection with “B. hominis” (data not shown).

