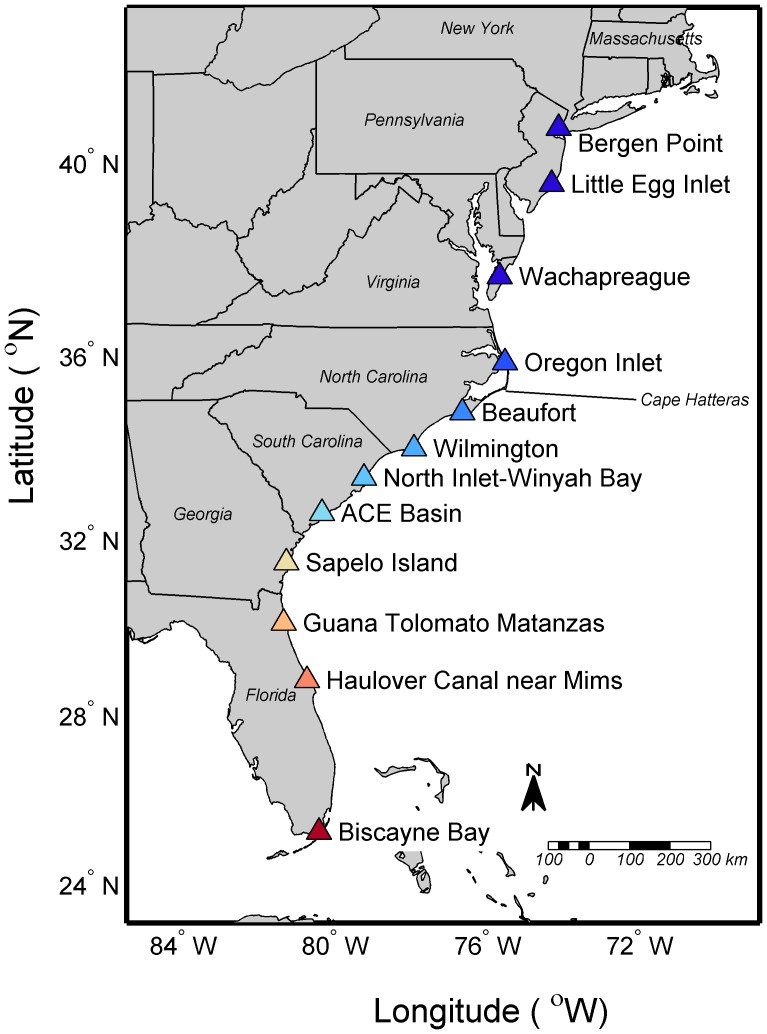
Figure 1. Map showing estuarine locations from which observed temperature records were used and for which projections were made for winter estuarine water temperatures.
Color-coding for sites is based on latitude (red more southern, blue more northern). Full list of sites is provided in [39] http://dx.doi.org/10.1016/j.jembe.2012.08.012.

